GCHART Procedure
- Syntax

- Overview
- Concepts
- Examples Specifying the Sum Statistic in a Block ChartGrouping and Subgrouping a Block ChartSpecifying the Sum Statistic in Bar ChartsSubgrouping a Three-Dimensional Vertical Bar ChartControlling Midpoints and Statistics in a Horizontal Bar ChartGenerating Error Bars in a Horizontal Bar ChartSpecifying the Sum Statistic for a Pie ChartSubgrouping a Donut or Pie ChartOrdering and Labeling Slices in a Pie ChartGrouping and Arranging Pie ChartsSpecifying the Sum Statistic in a Star ChartCharting a Discrete Numeric Variable in a Star ChartCreating a Detail Pie Chart
- References
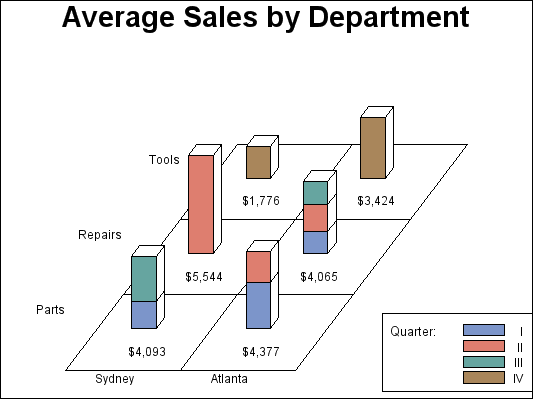
Example 2: Grouping and Subgrouping a Block Chart
| Features: |
BLOCK statement options GROUP=, LEGEND=, MIDPOINTS=, NOHEADING, SUBGROUP=, and TYPE= |
| Other features: |
GOPTION statement option BORDER, LABEL statement, LEGEND statement, and default pattern rotation |
| Sample library member: | GCHBKGRP |
This example
shows average quarterly sales for each department at two of the three
manufacturing sites in the TOTALS data set; it excludes the Paris
site from the chart.
The program groups the
chart data (sites) by department, and subgroups department sales data
by quarter. Each site is a midpoint. Because the sites are grouped
by department, each midpoint has a separate square for each department
and the height of the block represents total sales for that department.
The blocks are subgrouped
to show how quarterly sales contribute to total sales; each segment
represents sales for a quarter. A legend explaining the subgroup patterns
appears below the midpoint grid.
The subgroups use four
default patterns and colors that are retrieved from the current style.
The patterns are created by rotating the default fill, solid, through
the color list that is defined in the current style.
Program
goptions reset=all border;
data totals;
length dept $ 7 site $ 8;
input dept site quarter sales;
datalines;
Parts Sydney 1 3043.97
Parts Sydney 3 5142.63
Parts Atlanta 1 5225.26
Parts Atlanta 2 3529.06
Tools Sydney 4 1775.74
Tools Atlanta 4 3424.19
Repairs Sydney 2 5543.97
Repairs Atlanta 1 3788.93
Repairs Atlanta 2 4492.89
Repairs Atlanta 3 3914.25
;
title "Average Sales by Department";
legend1 cborder=black
label=("Quarter:")
position=(bottom right outside)
mode=protect
across=1;
proc gchart data=totals;
format quarter roman.;
format sales dollar8.;
label site="00"x dept="00"x;
block site / sumvar=sales
type=mean
midpoints="Sydney" "Atlanta"
group=dept
subgroup=quarter
legend=legend1
noheading;
run;
quit;
Program Description
Set the graphics environment. The
BORDER option in the GOPTIONS statement draws a black border around
the graph.
Create data set TOTALS. TOTALS
contains quarterly sales data for two of the three manufacturing
sites for one year. Sales figures are broken down by department.
data totals;
length dept $ 7 site $ 8;
input dept site quarter sales;
datalines;
Parts Sydney 1 3043.97
Parts Sydney 3 5142.63
Parts Atlanta 1 5225.26
Parts Atlanta 2 3529.06
Tools Sydney 4 1775.74
Tools Atlanta 4 3424.19
Repairs Sydney 2 5543.97
Repairs Atlanta 1 3788.93
Repairs Atlanta 2 4492.89
Repairs Atlanta 3 3914.25
;
Define legend characteristics. LABEL=
assigns new text to the legend label. CBORDER= draws a black frame
around the legend.
Produce the block chart. The
LABEL statement suppresses the midpoint and group labels by assigning
a null hexadecimal string to each variable name.
The TYPE= option specifies
the chart statistic as the mean value of the summary variable SALES
for each site. The MIDPOINTS= option selects the two sites and the
order in which they appear. The GROUP= option creates a separate row
of blocks for each different value of DEPT. The SUBGROUP= option divides
each block into separate segments for the four quarters. The LEGEND=
option assigns the LEGEND1 statement to the graph. NOHEADING suppresses
the default heading that would otherwise appear above the chart.