GCHART Procedure
- Syntax

- Overview
- Concepts
- Examples Specifying the Sum Statistic in a Block ChartGrouping and Subgrouping a Block ChartSpecifying the Sum Statistic in Bar ChartsSubgrouping a Three-Dimensional Vertical Bar ChartControlling Midpoints and Statistics in a Horizontal Bar ChartGenerating Error Bars in a Horizontal Bar ChartSpecifying the Sum Statistic for a Pie ChartSubgrouping a Donut or Pie ChartOrdering and Labeling Slices in a Pie ChartGrouping and Arranging Pie ChartsSpecifying the Sum Statistic in a Star ChartCharting a Discrete Numeric Variable in a Star ChartCreating a Detail Pie Chart
- References
Example 6: Generating Error Bars in a Horizontal Bar Chart
| Features: |
HBAR statement options CLM=, ERRORBAR=, FREQLABEL=, MEANLABEL=, NOFRAME, SUMVAR=, and TYPE= HBAR statement options: |
| Other features: |
GOPTIONS statement option BORDER and AXIS statement |
| Sample library member: | GCHERRBR |
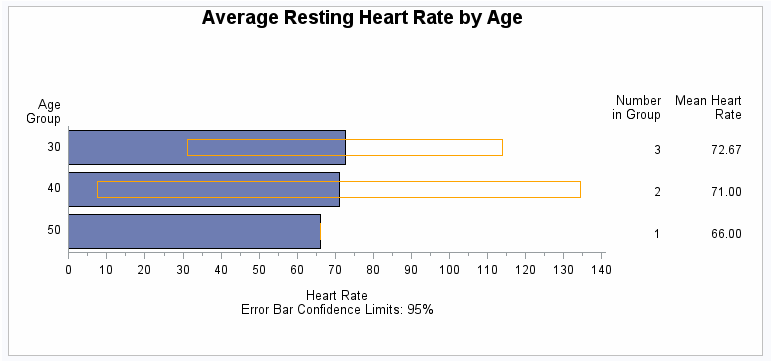
This example uses
the FITNESS data set to chart the mean heart rate for each age group
with error bars showing the confidence limits for the average. The
response axis label describes the confidence limit for the error bars.
To make the error bars easier to read, the program suppresses the
frame that the procedure draws around the axis area. Descriptive column
head labels in the table of statistics replace the statistic names
that appear by default.
Program
goptions reset=all border;
data fitness;
input age sex $ heart exer aero;
datalines;
28 M 86 2 36.6
41 M 76 3 26.7
30 M 78 2 33.8
29 M 54 3 44.8
48 F 66 2 28.9
36 F 66 2 33.2
;
title1 "Average Resting Heart Rate by Age";
axis1 label=("Heart Rate" j=c "Error Bar Confidence Limits: 95%")
minor=(number=1);
axis2 label=("Age" j=r "Group");
proc gchart data=fitness;
hbar age / type=mean
sumvar=heart
freqlabel="Number in Group"
meanlabel="Mean Heart Rate"
errorbar=bars
cerror=orange
clm=95
midpoints=(30 40 50)
raxis=axis1
maxis=axis2
noframe;
run;
quit;
Program Description
Set the graphics environment. The
BORDER option in the GOPTIONS statement draws a black border around
the graph.
Create the data set FITNESS. FITNESS
contains age and sex of participants, as well as the number of times
they exercise each week and their resting heart rate and aerobic power.
data fitness;
input age sex $ heart exer aero;
datalines;
28 M 86 2 36.6
41 M 76 3 26.7
30 M 78 2 33.8
29 M 54 3 44.8
48 F 66 2 28.9
36 F 66 2 33.2
;
Modify the axis labels. AXIS1
is assigned to the response axis and AXIS2 is assigned to the midpoint
axis.
axis1 label=("Heart Rate" j=c "Error Bar Confidence Limits: 95%")
minor=(number=1);
axis2 label=("Age" j=r "Group");
Produce the horizontal bar chart. The SUMVAR= option calculates the mean of the variable
HEART for all the observations in each midpoint group. The TYPE= option
specifies the mean statistic for the summary variable, HEART. The
FREQLABEL= and MEANLABEL= options specify new column labels for the
frequency and mean statistics. The ERRORBAR= option draws the error
bars as empty bars and CLM= specifies the confidence level. The NOFRAME
option suppresses the axis area frame.