GCHART Procedure
- Syntax

- Overview
- Concepts
- Examples Specifying the Sum Statistic in a Block ChartGrouping and Subgrouping a Block ChartSpecifying the Sum Statistic in Bar ChartsSubgrouping a Three-Dimensional Vertical Bar ChartControlling Midpoints and Statistics in a Horizontal Bar ChartGenerating Error Bars in a Horizontal Bar ChartSpecifying the Sum Statistic for a Pie ChartSubgrouping a Donut or Pie ChartOrdering and Labeling Slices in a Pie ChartGrouping and Arranging Pie ChartsSpecifying the Sum Statistic in a Star ChartCharting a Discrete Numeric Variable in a Star ChartCreating a Detail Pie Chart
- References
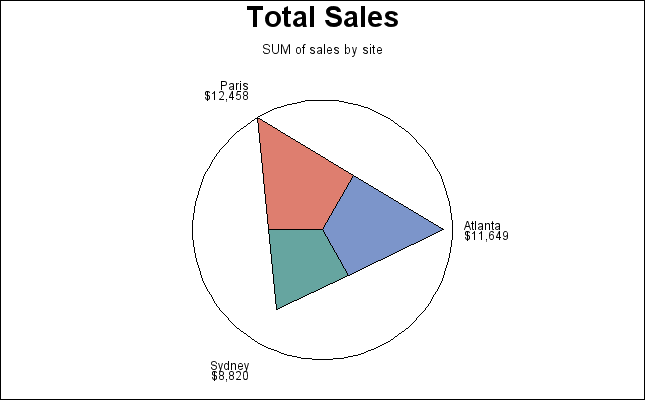
Example 11: Specifying the Sum Statistic in a Star Chart
| Features: |
STAR statement option SUMVAR= |
| Other features: |
FORMAT statement |
| Sample library member: | GCHSTSUM |
This example produces a star chart of total sales for
three sites by charting the values of the character variable SITE
and calculating the sum of the variable SALES for each site. It represents
the statistics as slices of the star. The center of the circle represents
0 and the edge of the circle represents the largest value, in this
case Paris sales. By default, the spines are joined and filled with
a solid pattern to form slices, and the midpoint value and the formatted
values of the sales statistics are printed beside each slice.
Program
goptions reset=all border;
data totals;
length dept $ 7 site $ 8;
input dept site quarter sales;
datalines;
Parts Sydney 1 7043.97
Parts Atlanta 1 8225.26
Parts Paris 1 5543.97
Tools Sydney 4 1775.74
Tools Atlanta 4 3424.19
Tools Paris 4 6914.25
;
title "Total Sales";
proc gchart data=totals;
format sales dollar8.;
star site / sumvar=sales;
run;
quit;
Program Description
Create data set TOTALS. TOTALS
contains quarterly sales data for three manufacturing sites for one
year. Sales figures are broken down by department.
data totals;
length dept $ 7 site $ 8;
input dept site quarter sales;
datalines;
Parts Sydney 1 7043.97
Parts Atlanta 1 8225.26
Parts Paris 1 5543.97
Tools Sydney 4 1775.74
Tools Atlanta 4 3424.19
Tools Paris 4 6914.25
;