G3D Procedure

Example 5: Generating a Scatter Plot with Modified Shapes
| Features: |
SCATTER statement
|
| Other features: |
NOTE statement DATA Step |
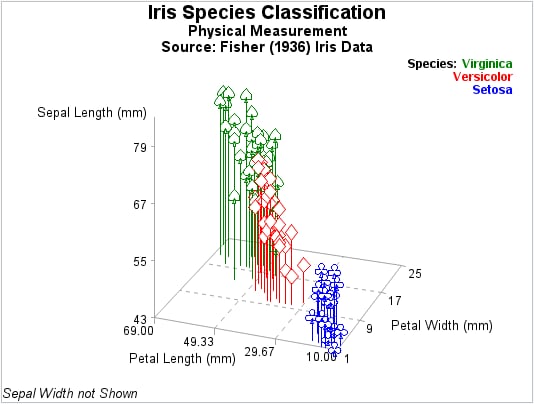
This scatter plot modifies
the results of measuring the petal length, petal width, and sepal
length for the flowers of three species of irises. It uses a DATA
step to add a color variable and a shape variable to the data set,
shapes to distinguish iris species, colors to distinguish iris species,
and a NOTE statement to simulate a legend.
Program
goptions reset=all border;
title1 "Iris Species Classification";
title2 "Physical Measurement";
title3 "Source: Fisher (1936) Iris Data";
footnote1 j=l "Sepal Width not Shown";
data iris;
  set sashelp.iris;
  length color shape $8.;
  if species="Setosa" then do; shape="club"; color="blue"; end;
  if species="Versicolor" then do; shape="diamond"; color="red"; end;
  if species="Virginica" then do; shape="spade"; color="green"; end;
run;
proc g3d data=iris;
note j=r f="Albany AMT/bo" "Species:  " c=green "Virginica      "
         j=r    c=red "Versicolor      "
         j=r    c=blue "Setosa      ";
 scatter PetalLength*PetalWidth=SepalLength/
      color=color
      shape=shape
      size=1.5;
run;
quit;
Program Description
title1 "Iris Species Classification";
title2 "Physical Measurement";
title3 "Source: Fisher (1936) Iris Data";
footnote1 j=l "Sepal Width not Shown";