G3D Procedure

Overview: G3D Procedure
The G3D procedure enables you to produce three-dimensional
surface plots and scatter plots.
Surface Plots
Surface plots represent
the shape of the surface that is described by the values of three
variables, X, Y, and Z. The values of the X and Y variables are plotted
to form a horizontal plane. The values of the Z variable, create a
vertical axis that is perpendicular to the X-Y plane. Combined, these
three axes, form a three-dimensional surface.
The surface plot in
the following figure displays various depths of a lake. The dimensions
of the lake are plotted on the X-Y axes. The Z variable is plotted
as the third dimension. The coordinates of each point correspond to
the values of the three numeric variable values in an observation
from the selected input data set.
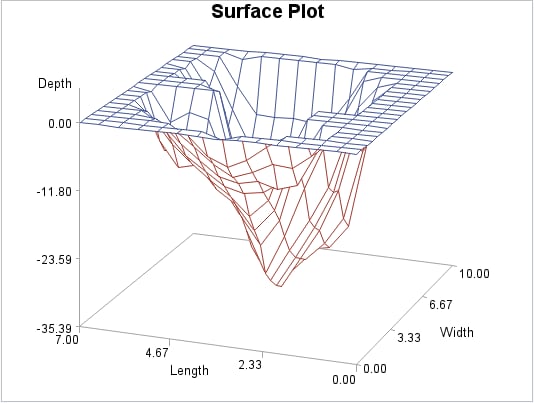
The program for this
figure is featured in Generating A Surface Plot. For more information
about producing surface plots, see the PLOT Statement.
Scatter Plots
Scatter plots represent
the data as points. As with surface plots, the values of the X and
Y variables are plotted to form a horizontal plane. The values of
the Z variable create a vertical axis that is perpendicular to the
X-Y horizontal plane. The values of the Z variable are represented
as individual symbols. By default, these symbols are connected to
the horizontal plane with lines, referred to as needles.
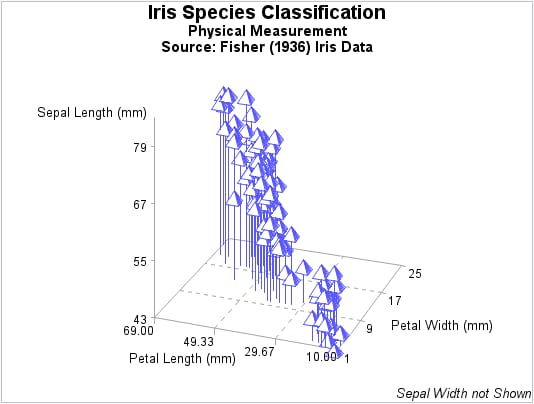
For more information
about producing scatter plots, see the SCATTER Statement.