GTILE Procedure

Example 3: Specifying the COLORPOINTS= Option and a Custom Color Ramp Range
| Features: |
|
| Data set: | SASHELP.SHOES |
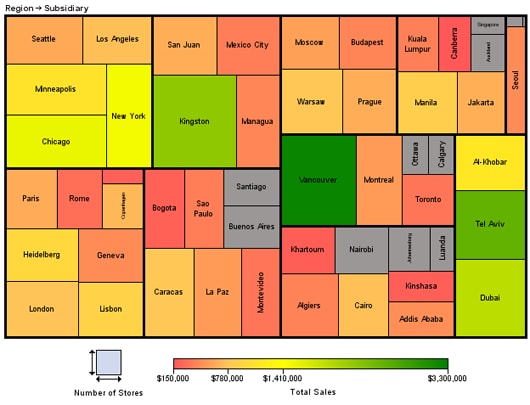
In this example, PROC GTILE generates the chart shown in Tile Chart with Custom Color Points and a Custom Color Ramp Range for SASHELP.SHOES.
The TILE statement defines the layout of the data. The tile sizes
are determined by the number of stores in each subsidiary of each
region. The COLORVAR=SALES specifies that the color of each tile represents
the sales revenue for that subsidiary in that region. The COLORRAMP=
option specifies that the color ramp colors consist of light red,
light orange, medium yellow, and green. The COLORPOINTS= option specifies
that the colors on the color ramp start at 0, and transition at 20%,
40%, and 100% of the legend value range. The MINLEGENDVALUE= and MAXLEGENDVALUE=
options specify a custom legend range of 150000 to 3300000. Tiles
whose SALES value falls outside of the legend range are colored gray
as shown.
Program
goptions reset=all noborder device=javaimg border;
proc gtile data=sashelp.shoes;
  tile stores tileby=(region subsidiary) /
     colorvar=sales
     colorramp=(lightred lightorange mediumyellow green)
     colorpoints=(0 0.2 0.4 1)
     minlegendvalue=150000
     maxlegendvalue=3300000
     detaillevel=2
     labellevel=2;
run;
quit;
Program Description
Specify the graphics options. Remove the border around the chart and specify the JAVAIMG device
to create a static image.
Define the color ramp and specify the color transition
points.Specify the colors light red,
light orange, medium yellow, and green for the color ramp colors.
Set the transition points at 0%, 20%, 40%, and 100%.