GTILE Procedure

FLOW, TILE, and TOGGLE Statement
| Requirement: | At least one numeric chart size variable and one TILEBY= variable is required. |
| Global statements: | FOOTNOTE, GOPTIONS, TITLE |
| Supports: | Drill-down functionality |
Syntax
Summary of Optional Arguments
Required Arguments
Optional Arguments
The options in a GTILE statement affect all chart levels. Specify as many options as you want and list them in any order.
- CDEFAULT=missing-value-color
- specifies the color to be assigned to tiles when
the COLORVAR= value is missing. The color used to identify
missing values is represented by a missing color indicator to the
right of the legend.
Alias:CDEF=Restriction:Partially supported by ActiveX.Interaction:This option is ignored when COLORTYPE=DISCRETE.
- COLORPOINTS=(point-1 point-2 ... point-n)
- specifies where the colors need to transition on
the color ramp with respect to the normalized values of the color
variable. The colors are specified
by the COLORRAMP= option. A value must be provided for each color
that is specified by the COLORRAMP= option. You can use a space or
a comma to separate the values. Each transition point is specified
as a percentage of the total range of the color ramp. For example,
if COLORRAMP=(red green blue), COLORPOINTS=(0, 0.75 1), and the range
of the color variable is 100, the color ramp begins with red at 0,
transitions to green at 75, and then transitions to blue at 100.
By default, the range is set to the range of the color variable. The
range can be modified with the MAXLEGENDVALUE= and MINLEGENDVALUE=
options.Default:The color transition points are distributed equally along the color ramp.Range:0 to 1Requirements:The COLORRAMP= option must be specified before you can use the COLORPOINTS= option.
The number of values that are specified in the COLORPOINTS= option must exactly match the number of colors that are specified in the COLORRAMP= option.
Interactions:This option is ignored when COLORTYPE=DISCRETE.The MAXLEGENDVALUE= and MINLEGENDVALUE= options modify the range of the color ramp.
See:COLORRAMP=
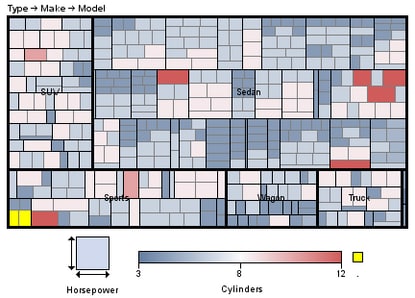
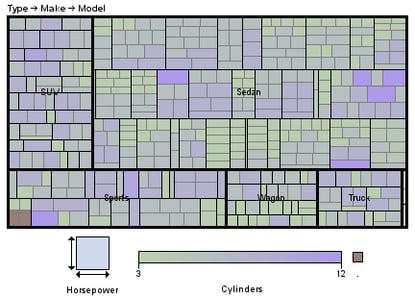
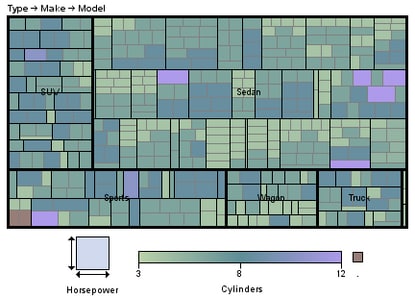
- COLORRAMP=(color-ramp color-list)
- specifies the colors to be distributed continuously
across the range of data values. The three-color gradient
legend provides a key to the value of the colors plotted on the chart.
The legend label is the variable used to color the tiles. The legend
displays the variable's minimum value, the maximum value, and the
midpoint value.Note: When the COLORRAMP= option is used with the ACTIVEX device, the graph viewers cannot change the color ramp colors using the ActiveX Control Properties dialog box. In that case, the color gradient color pickers are disabled on the Tile tab.Two colors are required to create a color ramp. However, the number of colors that can be provided is not limited. These values specify the minimum, and the maximum values of the color ramp. If only two colors are specified, the legend midpoint is not be labeled. The delimiter can be either blank spaces or commas. All of the color-naming schemes supported by
SAS/GRAPH Alias:RAMP=Style reference:Color attribute of the ThreeColorRamp elementInteraction:This option is ignored when COLORTYPE=DISCRETE.Note:When the COLORRAMP= option is used to specify custom colors and the ACTIVEX device is used to generate the chart, the chart users cannot change the chart’s gradient colors from the Tile tab of the ActiveX Control Properties dialog box. In that case, Color under Color gradient is disabled on the Tile tab.Specifying the COLORPOINTS= Option and a Custom Color Ramp Range
- COLORTYPE=CONTINUOUS | DISCRETE
- specifies whether a color ramp or discrete colors
are used to color the tiles. When COLORTYPE=CONTINUOUS,
a color ramp is used to color the tiles. A continuous legend is used
in that case to denote the tile colors. When COLORTYPE=DISCRETE, discrete
colors are used to color the tiles. A discrete legend is used to denote
the tile colors in that case.Default:CONTINUOUS when COLORVAR= is not specified or when COLORVAR= specifies a numeric variable
DISCRETE when COLORVAR= specifies a character variable
Style references:GraphData1–GraphDataN (DISCRETE only), the color attribute of the ThreeColorRamp element (CONTINUOUS only)Restrictions:The legend is always positioned at the bottom of the chart. Because the LEGEND statement is not supported, the legend cannot be relocated.When COLORTYPE=DISCRETE, you must use the COLORS= graphics option to change the chart colors from the default GraphData1 through GraphDataN colors. See COLORS.
Interaction:When COLORTYPE=DISCRETE, the COLORPOINTS=, COLORRAMP=, DETAILLEVEL=, MINLEGENDVALUE=, and MAXLEGENDVALUE= options are ignored.Note:When the COLORTYPE=DISCRETE option is used and the ACTIVEX or JAVA device is used to generate the chart, the chart users cannot change the chart’s gradient colors using the ActiveX Control or Java Applet pop-up menu. For the ActiveX Control, Colors and Center are disabled on the Tile tab on the Properties dialog box in that case. For the Java Applet, GradientEditor is disabled on the Data Options dialog box in that case.See:COLORRAMP=Example:Specifying Discrete Tile Colors
- COLORVAR=color-variable
- specifies a variable whose values determine the color of the tiles. The variable can be character or numeric. The values of this variable are sorted in ascending order. The smallest value is assigned to the first color in the color ramp, and the largest value is assigned the last color in the color ramp. Each of the remaining values is assigned a color from the gradient list of colors between the first, and the last colors in the color ramp.
- DESCRIPTION=“description”
- specifies a description of the output. The maximum length
for description is 256 characters.
The description does not appear in the output. The descriptive text
is shown in each of the following:
-
the chart description for Web output (depending on the device driver that you are using). See Chart Descriptions for Web Presentations for more information.
The description can include the #BYLINE, #BYVAL, and #BYVAR substitution options, which work as they do when used on TITLE, FOOTNOTE, and NOTE statements. Refer to Substituting BY Line Values in a Text String. The 256-character limit applies before the substitution takes place for these options. Thus, if in the SAS program the description text exceeds 256 characters, it is truncated to 256 characters, and then the substitution is performed.Alias:DES=Default:Tile chart of tilebyRestriction:Partially supported by ActiveX and Java. -
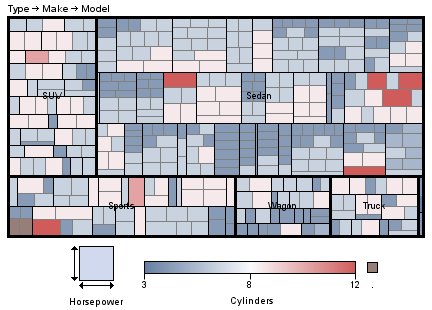
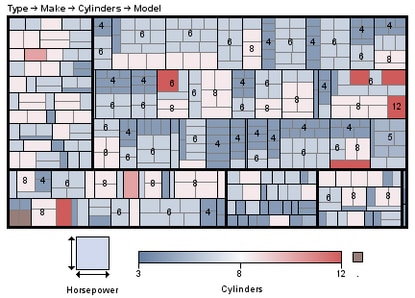
- DETAILLEVEL=1-to-the-number-of-variables-specified-by-TILEBY=
- specifies the number of levels to display. The valid values for
the DETAILLEVEL= option are from one to the number of variables listed
in the TILEBY= levels list. Each level has a unique outline. As you
drill down through the levels, the second level lines are thinner
in weight and lighter in color. As you drill down to the third and
lower levels, the outlines are the same as the top level. The levels
are listed above the chart on the left. The DETAILLEVEL= option does
not affect the drill-down functionality.
If the DETAILLEVEL=1, only the first level of detail is initially displayed. Only the details of the current level are displayed at any given point in the navigation.Alias:DLEVEL=Default:3Interaction:This option is ignored when COLORTYPE=DISCRETE.
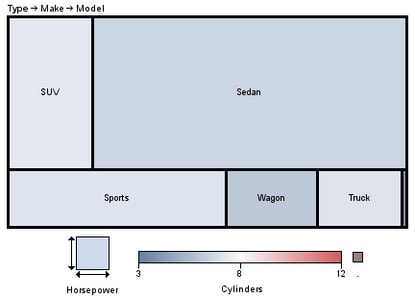
- LABELLEVEL=1-to-the-number-of-levels-variables-specified-by-TILEBY=
- specifies the number that corresponds to the level
of labels to display. The valid values for
the LABELLEVEL= option are from one to the number of variables listed
in the TILEBY=levels list. The levels are listed above the chart,
on the left. The LABELLEVEL= option does not affect the drill-down
functionality.
If LABELLEVEL=3, the third level labels are displayed. Once you navigate past the LABELLEVEL specified, subsequent levels display their respective labels.LABELLEVEL=3
 Alias:LLEVEL=Default:1
- MAXLEGENDVALUE=max-value
- specifies the maximum endpoint value of a continuous
legend range. By default, the maximum
legend endpoint value is set to the highest data value. The MAXLEGENDVALUE=
option overrides the default value. Tiles whose data value exceeds
MAXLEGENDVALUE are colored gray.Interaction:This option is ignored when COLORTYPE=DISCRETE.
- MINLEGENDVALUE=min-value
- specifies the minimum endpoint value of a continuous
legend range. By default, the minimum
legend endpoint value is set to the lowest data value. The MINLEGENDVALUE=
option overrides the default value. Tiles whose data values are less
than MINLEGENDVALUE are colored gray.Interaction:This option is ignored when COLORTYPE=DISCRETE.