GTILE Procedure

Example 4: Specifying Discrete Tile Colors
| Features: |
FLOW statement options COLORVAR= and COLORTYPE= |
| Data set: | SASHELP.ORSALES |
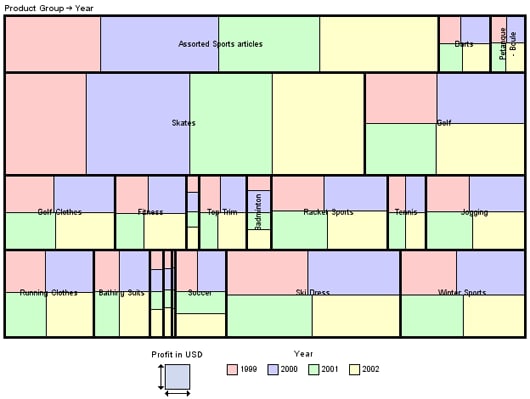
In this example, PROC GTILE generates the chart shown in Tile Chart That Uses Discrete Tile Colors for a subset
of SASHELP.ORSALES. The FLOW statement defines the layout of the data.
The tile sizes are determined by the total profits that were generated
by each product group for each year. The COLORVAR=YEAR specifies that
the color of each tile represents the sales revenue for that product
group for that year. The COLORTYPE= option specifies that discrete
colors are to be used. The GOPTIONS statement COLORS= option is used
to specify that the discrete colors CXFFCCCC (light red), CXCCCCFF
(light blue), CXCCFFCC (light green), and CXFFFFCC (light yellow)
are to be used in the chart instead of the default GraphData1 through
GraphData4 colors.