GTILE Procedure

Example 2: Specifying the COLORRAMP= Option, and Setting the DETAILLEVEL= Option
| Features: |
|
| Data set: | SASHELP.ORSALES Subset |
| Sample library member: | GTLCOLOR |
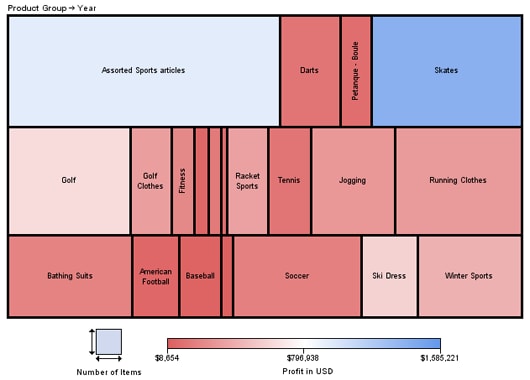
In this example, PROC
GTILE generates the following chart, which displays a subset of the
SASHELP.ORSALES data set. The FLOW statement defines the layout of
the data. The size of each tile indicates the number of items sold.
The color of each tile indicates the profit. The visualization of
the data with the GTILE procedure makes it easy to see the data extremes
for profit relative to the number of items sold.
Tile Chart of SASHELP.ORSALES Where PRODUCT_LINE=“SPORTS”
Program
goptions reset=all device=java noborder;
data sports_only;
  set sashelp.orsales;
  if product_line="Sports";
  format profit dollar12.;
  format quantity comma12.;
run;
proc gtile data=sports_only;
    flow quantity tileby=(product_group year) /
        colorvar=profit
        /* display less details */
        detaillevel=1
        /* reverse the colors so that blue is highest */
        colorramp=(CXDD6060 CXFFFFFF CX6497EB);
run;
quit;
Program Description
data sports_only;
  set sashelp.orsales;
  if product_line="Sports";
  format profit dollar12.;
  format quantity comma12.;
run;
Generate the tile chart using PROFIT as the color variable,
1 as the detail level, and a three-color color ramp.The chart variable QUANTITY specifies the size of
the tiles. The FLOW layout arranges the tiles. The TILEBY=(levels-list) variable list defines the tile
segments and the chart levels. The COLORVAR=PROFIT option specifies
the variable to use to color the tiles. The DETAILLEVEL=1 option defines
the level of display detail. The COLORRAMP= option reverses the colors.
Blue represents the highest value. Red represents the lowest value.