GPLOT Procedure
- Syntax

- Overview
- Concepts
- Examples Generating a Simple Bubble PlotLabeling and Sizing Plot BubblesAdding a Right Vertical AxisPlotting Two VariablesConnecting Plot Data PointsGenerating an Overlay PlotFilling Areas in an Overlay PlotPlotting Three VariablesPlotting with Different Scales of ValuesCreating Plots with Drill-down Functionality for the Web
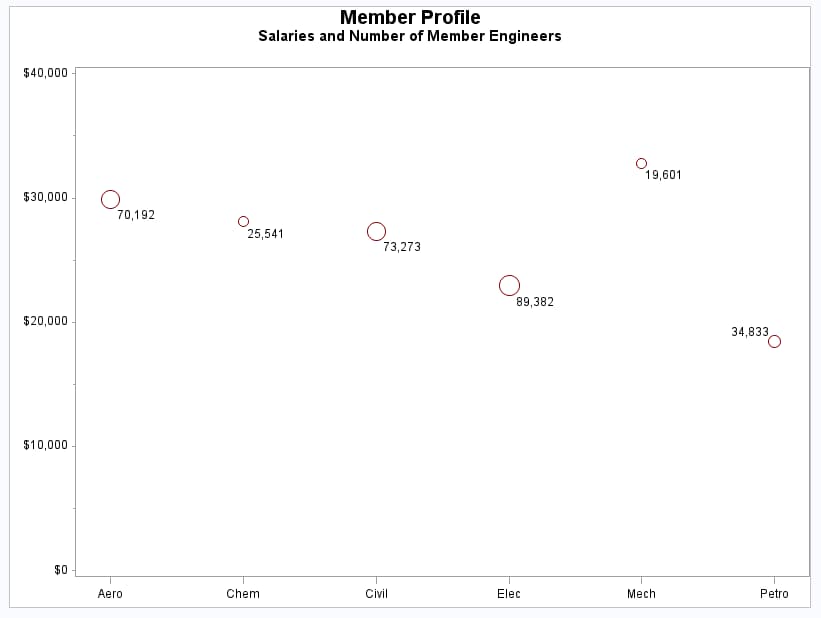
Example 2: Labeling and Sizing Plot Bubbles
| Features: |
|
| Other features: |
GOPTIONS statement option: BORDER AXIS statement |
| Sample library member: | GPLBUBL2 |
This example modifies
the code in Example 1. It shows how BUBBLE statement options control
the appearance of bubbles and their labels. It also shows how AXIS
statements can modify the plot axes.
Program
goptions reset=all border;
data jobs;
   length eng $5;
   input eng dollars num;
   datalines;
Civil 27308 73273
Aero  29844 70192
Elec  22920 89382
Mech  32816 19601
Chem  28116 25541
Petro 18444 34833
;
title1 "Member Profile";
title2 "Salaries and Number of Member Engineers";
axis1 label=none
      offset=(5,5);
axis2 order=(0 to 40000 by 10000)
      label=none;
proc gplot data=jobs;
   format dollars dollar9. num comma7.0;
   bubble dollars*eng=num / haxis=axis1
                            vaxis=axis2
                            vminor=1
                            bcolor=darkred
                            blabel
                            bsize=3;
run;
quit;
Program Description
Create the data set. The
data set JOBS contains average salary data for several categories
of engineer. It also indicates the number of engineers in each category.
data jobs;
   length eng $5;
   input eng dollars num;
   datalines;
Civil 27308 73273
Aero  29844 70192
Elec  22920 89382
Mech  32816 19601
Chem  28116 25541
Petro 18444 34833
;
Define axis characteristics. AXIS1
suppresses the horizontal axis label and uses the OFFSET= option to
move the first and last major tick mark values away from the vertical
axes so that bubbles are not clipped. AXIS2 uses the ORDER= option
to set major tick mark intervals. This could be done with the VAXIS=
option in the BUBBLE statement, but then you could not suppress the
axis label and alter other axis characteristics.
Generate bubble plot. The
VMINOR= option specifies one minor tick mark for the vertical axis.
The BLABEL option labels each bubble with the value of variable NUM.
Then BCOLOR= option specifies the color for the bubbles. The BLABEL
option labels the bubbles with the value of the third variable, which
in this case is the number of engineers in the job category. The BSIZE
option specifies the size of the bubbles.