GPLOT Procedure
- Syntax

- Overview
- Concepts
- Examples Generating a Simple Bubble PlotLabeling and Sizing Plot BubblesAdding a Right Vertical AxisPlotting Two VariablesConnecting Plot Data PointsGenerating an Overlay PlotFilling Areas in an Overlay PlotPlotting Three VariablesPlotting with Different Scales of ValuesCreating Plots with Drill-down Functionality for the Web
Example 10: Creating Plots with Drill-down Functionality for the Web
| Features: |
|
| Other features: |
GOPTIONS statement option: BORDER BY statement GOPTIONS statement |
| Sample library member: | GPLDRIL1 |
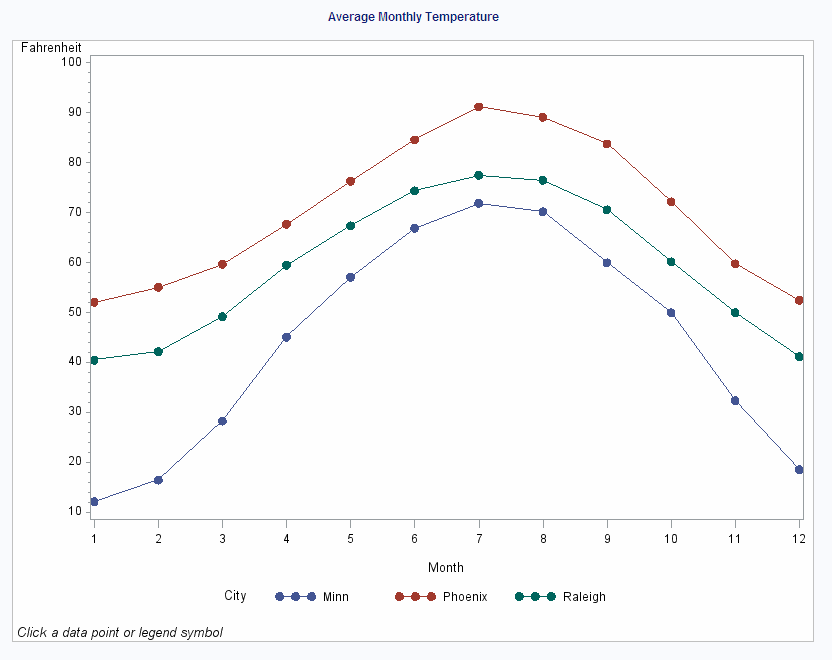
This example shows
how to create a plot with simple drill-down functionality for the
Web. If you display the plot in a Web browser, you can select any
plot point or legend symbol to display a report on monthly temperatures
for the selected city.
The example explains
how to use an ODS statement such as ODS HTML to generate a graph with
drill-down links. It shows how to do the following actions:
For more information
about drill-down graphs, see Adding Links and Enhancements with the URL=, HTML=, and HTML_LEGEND= Options.
This program modifies
the code from sample GPLVRBL2, which shows how to generate separate
plots for the formatted values of a classification variable. In this
example, the code implements drill-down capability for the plot, enabling
you to select any plot point or legend symbol to drill down to a report
on the yearly temperatures for the corresponding city. The first figure
shows the drill-down plot as it is viewed in a browser.
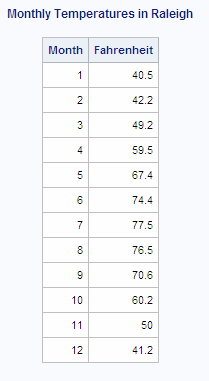
The second figure shows
the report that appears when you select any plot point or legend symbol
that corresponds to the data for Raleigh.
Program
filename odsout "C:\";
goptions reset=all border device=gif;
ods html path=odsout
         body="city_plots.html"
         nogtitle;
data citytemp;
   input  Month Fahrenheit City $ @@;
   datalines;
   1      40.5    Raleigh     1      12.2    Minn
   1      52.1    Phoenix     2      42.2    Raleigh
   2      16.5    Minn        2      55.1    Phoenix
   3      49.2    Raleigh     3      28.3    Minn
   3      59.7    Phoenix     4      59.5    Raleigh
   4      45.1    Minn        4      67.7    Phoenix
   5      67.4    Raleigh     5      57.1    Minn
   5      76.3    Phoenix     6      74.4    Raleigh
   6      66.9    Minn        6      84.6    Phoenix
   7      77.5    Raleigh     7      71.9    Minn
   7      91.2    Phoenix     8      76.5    Raleigh
   8      70.2    Minn        8      89.1    Phoenix
   9      70.6    Raleigh     9      60.0    Minn
   9      83.8    Phoenix    10      60.2    Raleigh
  10      50.0    Minn       10      72.2    Phoenix
  11      50.0    Raleigh    11      32.4    Minn
  11      59.8    Phoenix    12      41.2    Raleigh
  12      18.6    Minn       12      52.5    Phoenix
;
data newtemp;
   set citytemp;
   length citydrill $ 40;
        if city="Minn" then
      citydrill="HREF='city_reports.html#IDX'";
   else if city="Phoenix" then
      citydrill="HREF='city_reports.html#IDX1'";
   else if city="Raleigh" then
      citydrill="HREF='city_reports.html#IDX2'";
title1 "Average Monthly Temperature";
footnote1 j=l " Click a data point or legend symbol";

symbol1 interpol=join
        value=dot;
proc gplot data=newtemp;
   plot fahrenheit*month=city / hminor=0
        html=citydrill
        html_legend=citydrill;
run;
quit;
 ods html path=odsout
body="city_reports.html";
proc sort data=newtemp;
   by city month;
run;
quit;
goptions reset=footnote;
option nobyline;
title1 "Monthly Temperatures in #byval(city)";
proc report data=newtemp nowindows;
  by city;
  column city month fahrenheit;
  define city       / noprint group;
  define month      / group;
  define Fahrenheit / group;
run;
quit;
Program Description
data citytemp;
   input  Month Fahrenheit City $ @@;
   datalines;
   1      40.5    Raleigh     1      12.2    Minn
   1      52.1    Phoenix     2      42.2    Raleigh
   2      16.5    Minn        2      55.1    Phoenix
   3      49.2    Raleigh     3      28.3    Minn
   3      59.7    Phoenix     4      59.5    Raleigh
   4      45.1    Minn        4      67.7    Phoenix
   5      67.4    Raleigh     5      57.1    Minn
   5      76.3    Phoenix     6      74.4    Raleigh
   6      66.9    Minn        6      84.6    Phoenix
   7      77.5    Raleigh     7      71.9    Minn
   7      91.2    Phoenix     8      76.5    Raleigh
   8      70.2    Minn        8      89.1    Phoenix
   9      70.6    Raleigh     9      60.0    Minn
   9      83.8    Phoenix    10      60.2    Raleigh
  10      50.0    Minn       10      72.2    Phoenix
  11      50.0    Raleigh    11      32.4    Minn
  11      59.8    Phoenix    12      41.2    Raleigh
  12      18.6    Minn       12      52.5    Phoenix
;
Add the HTML variable to CITYTEMP and create the NEWTEMP
data set. The HTML variable CITYDRILL
contains the target locations to associate with the different values
of the variable CITY. Each location for CITYDRILL references the file
city_reports.html, which this program will create. Each location ends
with the default anchor name (IDX1, IDX2, and IDX3) that ODS assigns
to the target output when it creates that output in file city_reports.html.
data newtemp;
   set citytemp;
   length citydrill $ 40;
        if city="Minn" then
      citydrill="HREF='city_reports.html#IDX'";
   else if city="Phoenix" then
      citydrill="HREF='city_reports.html#IDX1'";
   else if city="Raleigh" then
citydrill="HREF='city_reports.html#IDX2'";title1 "Average Monthly Temperature";
footnote1 j=l " Click a data point or legend symbol";
symbol1 interpol=join
value=dot;Generate the plot. Both
HTML= and HTML_LEGEND= specify CITYDRILL as the variable that contains
the targets for the drill-down links. The HTML= option determines
that each plot point will be a hot zone that links to target output,
and the HTML_LEGEND= option determines that the legend symbols will
be hot zones that link to target output. This GPLOT procedure generates
the first piece of output in this program. Thus, the plot receives
the first default anchor name, which is IDX.
proc gplot data=newtemp;
   plot fahrenheit*month=city / hminor=0
        html=citydrill
        html_legend=citydrill;
run;
quit;
Change the HTML file.The
BODY= option opens a new HTML file for storing the reports for city
temperatures. The new file is assigned the name city_reports.html,
which is the filename assigned above to variable CITYDRILL as part
of its target-link locations. The reports that are generated later
in this program are all written to this one HTML file.
Print a report of monthly temperatures for each city. The BY statement determines that a separate report
is generated for each city. Thus, the REPORT procedure generates three
pieces of output. To assign anchor locations to this new output, ODS
increments the last anchor name that was used (IDX) and therefore
assigns the anchor names IDX1, IDX2, and IDX3 to the output. These
are the anchor locations that were specified above as the anchor locations
for variable CITYDRILL.