GPLOT Procedure
- Syntax

- Overview
- Concepts
- Examples Generating a Simple Bubble PlotLabeling and Sizing Plot BubblesAdding a Right Vertical AxisPlotting Two VariablesConnecting Plot Data PointsGenerating an Overlay PlotFilling Areas in an Overlay PlotPlotting Three VariablesPlotting with Different Scales of ValuesCreating Plots with Drill-down Functionality for the Web
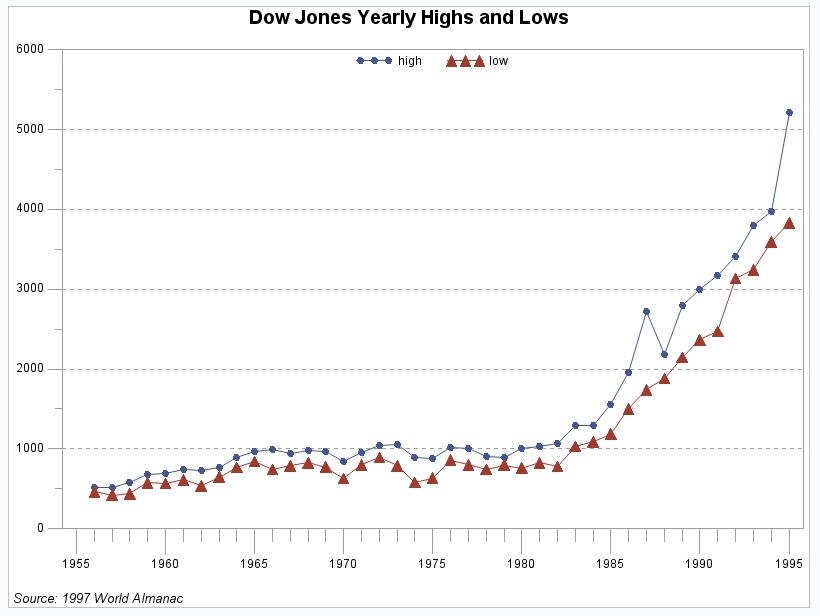
Example 6: Generating an Overlay Plot
| Features: |
|
| Other features: |
LEGEND statement SYMBOL statement |
| Sample library member: | GPLOVRL1 |
In this example, one
PLOT statement plots both the HIGH and LOW variables against the variable
YEAR using two plot requests. The OVERLAY option in the PLOT statement
determines that both plot lines appear on the same graph. The other
PLOT options scale the vertical axis, add a reference line to the
plot, and specify the number of minor tick marks on the axes. The
SYMBOL, AXIS, and LEGEND statements modify the plot symbols, axes,
and legend.
Program
goptions reset=all border;
data stocks;
   input year high low @@;

   datalines;
1956  521.05  462.35 1957  520.77  419.79
1958  583.65  436.89 1959  679.36  574.46
1960  685.47  568.05 1961  734.91  610.25
1962  726.01  535.76 1963  767.21  646.79
1964  891.71  768.08 1965  969.26  840.59
1966  995.15  744.32 1967  943.08  786.41
1968  985.21  825.13 1969  968.85  769.93
1970  842.00  631.16 1971  950.82  797.97
1972 1036.27 889.15 1973 1051.70  788.31
1974  891.66  577.60 1975  881.81  632.04
1976 1014.79  858.71 1977  999.75  800.85
1978  907.74  742.12 1979   897.61  796.67
1980 1000.17  759.13 1981 1024.05  824.01
1982 1070.55  776.92 1983 1287.20 1027.04
1984 1286.64 1086.57 1985 1553.10 1184.96
1986 1955.57 1502.29 1987 2722.42 1738.74
1988 2183.50 1879.14 1989 2791.41 2144.64
1990 2999.75 2365.10 1991 3168.83 2470.30
1992 3413.21 3136.58 1993 3794.33 3241.95
1994 3978.36 3593.35 1995 5216.47 3832.08
;
title1 "Dow Jones Yearly Highs and Lows";
footnote1 j=l " Source: 1997 World Almanac"
          ;
symbol1 interpol=join
        value=dot
        color=_style_;
symbol2 interpol=join
        value=C
        font=marker
        color=_style_ ;
axis1 order=(1955 to 1995 by 5) offset=(2,2)
      label=none
      major=(height=2)
     minor=(height=1)
      ;

axis2 order=(0 to 6000 by 1000) offset=(0,0)
      label=none
      major=(height=2)
     minor=(height=1)
      ;
legend1 label=none
        position=(top center inside)
        mode=share;
proc gplot data=stocks;
   plot high*year low*year / overlay legend=legend1
                             vref=1000 to 5000 by 1000
                             lvref=2
                             haxis=axis1 hminor=4
                             vaxis=axis2 vminor=1;
run;
quit;
Program Description
Create the data set. STOCKS
contains yearly highs and lows for the Dow Jones Industrial Average
and the dates of the high and low values each year.
data stocks;
   input year high low @@;

   datalines;
1956  521.05  462.35 1957  520.77  419.79
1958  583.65  436.89 1959  679.36  574.46
1960  685.47  568.05 1961  734.91  610.25
1962  726.01  535.76 1963  767.21  646.79
1964  891.71  768.08 1965  969.26  840.59
1966  995.15  744.32 1967  943.08  786.41
1968  985.21  825.13 1969  968.85  769.93
1970  842.00  631.16 1971  950.82  797.97
1972 1036.27 889.15 1973 1051.70  788.31
1974  891.66  577.60 1975  881.81  632.04
1976 1014.79  858.71 1977  999.75  800.85
1978  907.74  742.12 1979   897.61  796.67
1980 1000.17  759.13 1981 1024.05  824.01
1982 1070.55  776.92 1983 1287.20 1027.04
1984 1286.64 1086.57 1985 1553.10 1184.96
1986 1955.57 1502.29 1987 2722.42 1738.74
1988 2183.50 1879.14 1989 2791.41 2144.64
1990 2999.75 2365.10 1991 3168.83 2470.30
1992 3413.21 3136.58 1993 3794.33 3241.95
1994 3978.36 3593.35 1995 5216.47 3832.08
;
Define symbol characteristics. Each
SYMBOL statement specifies a symbol type for the plot symbols, and
connects the data points with a straight line.
symbol1 interpol=join
        value=dot
        color=_style_;
symbol2 interpol=join
        value=C
        font=marker
color=_style_ ;axis1 order=(1955 to 1995 by 5) offset=(2,2)
label=none
major=(height=2)
minor=(height=1)
;
axis2 order=(0 to 6000 by 1000) offset=(0,0)
label=none
major=(height=2)
minor=(height=1)
;Define legend characteristics. The
LABEL= option suppresses the legend label. The POSITION= option centers
the legend inside the top of the axis frame. The MODE= option shares
the legend area with other graphics elements.
Generate two plots and display them on the same set of
axes. The OVERLAY option specifies that
both plot lines appear on the same graph. The LEGEND= option assigns
the LEGEND1 definition to the graph. The VAXIS= option sets major
tick marks for the vertical axis. The HMINOR= and VMINOR= options
specify the number of tick marks between major tick marks.