The HPSPLIT Procedure

Measures of Model Fit
Various measures of model fit have been proposed in the data mining literature. The HPSPLIT procedure measures model fit based on a number of metrics for classification trees and regression trees.
Measures of Model Fit for Classification Trees
The HPSPLIT procedure measures model fit based on the following metrics for classification tree: entropy, Gini index, misclassification rate (Misc), residual sum of squares (RSS), average square error (ASE, also known as the Brier score), sensitivity, specificity, area under the curve (AUC), and confusion matrix.
Entropy for Classification Trees
Entropy for classifications tree is defined as
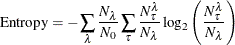
where
-
 is a leaf
-
 is the number of observations on the leaf
-
 is the total number of observations in the entire data set
-
 is a level of the response variable
-
 is the number of observations on the leaf that have the response level
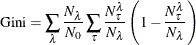
Gini Index for Classification Trees
The Gini index for classification trees is defined as
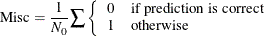
Misclassification Rate for Classification Trees
Misclassification (Misc) comes from the number of incorrectly predicted observations. It is defined as
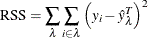
Residual Sum of Squares for Classification Trees
The residual sum of squares (RSS) for classification trees is defined as
![\begin{equation*} \mathrm{RSS} = \sum _\lambda \sum _\Phi N_\Phi ^\lambda \left[ \sum _{\tau \ne \Phi } \left( P_{\tau }^\lambda \right)^2 + \left(1 - P_{\Phi }^\lambda \right)^2 \right] \end{equation*}](images/statug_hpsplit0063.png)
where
-
 is the actual response level
-
 is the number of observations on the leaf that have the response level
-
 is the posterior probability for the response level on the leaf
-
 is the posterior probability for the actual response level on the leaf
Average Square Error for Classification Trees
The average square error (ASE) is also known as the Brier score for classification trees. It is defined as

where  is the number of levels for the response variable.
Sensitivity for Binary Classification Trees
Sensitivity is the probability of predicting an event for the response variable when the actual state is an event. For example, if the event is "an individual is sick," then sensitivity is the probability of predicting that an individual is sick given that the individual is actually sick. For binary classification trees, it is defined as
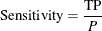
where
-
 is the number of true positives (predicting that an individual is sick)
-
P is the number of positive observations (sick individuals)
Specificity for Binary Classification Trees
Specificity is the probability of predicting a nonevent for the response variable when the actual state is a nonevent. For example, if the event is "an individual is sick," then specificity is the probability of predicting that an individual is not sick given the fact that the individual is actually not sick. For a binary classification tree, specificity is defined as
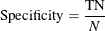
where
-
 is the number of true negatives (predicting that an individual is not sick)
-
N is the number of negative observations (healthy individuals)
Area under the Curve for Binary Classification Trees
Area under the curve (AUC) is defined as the area under the receiver operating characteristic (ROC) curve. PROC HPSPLIT uses sensitivity as the Y axis and 1 – specificity as the X axis to draw the ROC curve. AUC is calculated by trapezoidal rule integration,
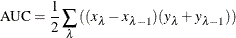
where
-
 is the sensitivity value at leaf
-
 is the 1 – specificity value at leaf
Note: For a binary response, the event level that is used for calculating sensitivity, specificity, and AUC is specified in the EVENT= option in the MODEL statement.
Confusion Matrix for Classification Trees
A confusion matrix is also known as a contingency table. It contains information about actual values and predicted values
from a classification tree. A confusion matrix has rows and columns, where each row corresponds to the actual response level and each column corresponds to the predicted response level.
The values in the matrix represent the number of observations that have the actual response represented in the row and the
predicted response represented in the column. The error rate per actual response level is also reported,
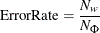
where
-
 is the number of wrong predictions
-
 is the number of observations that have the response level
Measures of Model Fit for Regression Trees
The HPSPLIT procedure measures model fit for regression trees based on RSS and ASE.
Residual Sum of Squares for Regression Trees
The residual sum of squares (RSS) for regression trees is defined as
where
-
i is an observation on the leaf
-
 is the predicted value of the response variable of the observation i
-
 is the actual value of the response variable on the leaf
Average Square Error for Regression Trees
The average square error (ASE) for regression trees is defined as
