The PARETO Procedure
- Overview
-
Getting Started

-
Syntax
-
Details
-
ExamplesCreating Before-and-After Pareto ChartsCreating Two-Way Comparative Pareto ChartsHighlighting the "Vital Few"Highlighting Combinations of CategoriesHighlighting Combinations of CellsOrdering Rows and Columns in a Comparative Pareto ChartMerging Columns in a Comparative Pareto ChartCreating Weighted Pareto ChartsCreating Alternative Pareto ChartsCustomizing Inset Labels and Formatting ValuesSpecifying Inset Headers and PositionsManaging a Large Number of Categories
- References
Note: See Displaying Summary Statistics on a Pareto Chart in the SAS/QC Sample Library.
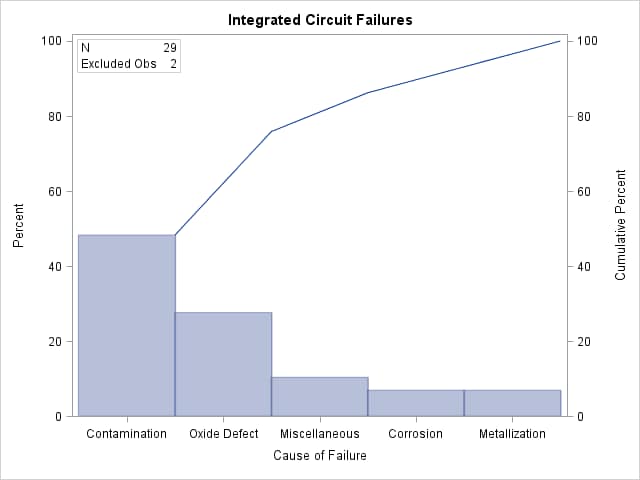
You can use an INSET statement to add a box or table (referred to as an inset) of summary statistics on a Pareto chart. The following statements generate a chart from the Failure2 data set and limit the number of categories to five:
data Failure2;
   length Cause $ 16 ;
   label  Cause = 'Cause of Failure' ;
   input  Cause $ 1-16 Count;
   datalines;
Contamination    14
Corrosion         2
Doping            1
Metallization     2
Miscellaneous     3
Oxide Defect      8
Silicon Defect    1
;
title 'Integrated Circuit Failures';
proc pareto data=Failure2;
   vbar Cause /
      freq     = Count
      maxncat  = 5
      odstitle = title;
   inset n nexcl;
run;
An INSET statement produces an inset on the chart that is created by the preceding HBAR or VBAR chart statement. You specify inset keywords to request summary statistics, and the statistics appear in the order in which you specify the keywords. The keyword N displays the number of categories that are displayed in the chart; the keyword NEXCL displays the number of categories that are excluded. A complete list of keywords available with the INSET statement is provided in the section INSET Statement Keywords.
The resulting chart is displayed in Figure 15.7.