The PARETO Procedure
- Overview
-
Getting Started

-
Syntax
-
Details
-
ExamplesCreating Before-and-After Pareto ChartsCreating Two-Way Comparative Pareto ChartsHighlighting the "Vital Few"Highlighting Combinations of CategoriesHighlighting Combinations of CellsOrdering Rows and Columns in a Comparative Pareto ChartMerging Columns in a Comparative Pareto ChartCreating Weighted Pareto ChartsCreating Alternative Pareto ChartsCustomizing Inset Labels and Formatting ValuesSpecifying Inset Headers and PositionsManaging a Large Number of Categories
- References
Note: See Highlighting Specific Pareto Categories in the SAS/QC Sample Library.
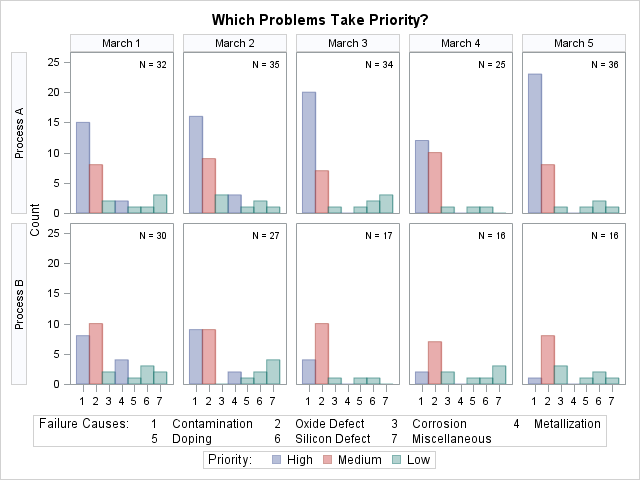
In some applications, it is useful to classify the categories into groups that are not necessarily related to frequency. This example, which is a continuation of Example 15.2, shows how you use a bar legend to display this classification.
Suppose that contamination and metallization are high-priority problems, oxide defect is a medium-priority problem, and all
other categories are low-priority problems. Begin by adding this information to the data set Failure4 as follows:
data Failure4;
   length Priority $ 16;
   set Failure4;
   if Cause = 'Contamination' or
      Cause = 'Metallization'
   then
      Priority = 'High';
   else
   if Cause = 'Oxide Defect'
   then
      Priority = 'Medium';
   else
      Priority = 'Low';
run;
The variable Priority indicates the priority that is associated with a defect cause.
The following statements specify Priority in both the BARS=
and BARLEGEND=
options:
title 'Which Problems Take Priority?';
proc pareto data=Failure4;
   vbar Cause / class       = ( Process Day )
                freq        = Counts
                nrows       = 2
                ncols       = 5
                last        = 'Miscellaneous'
                scale       = count
                bars        = ( Priority )
                barlegend   = ( Priority )
                barleglabel = 'Priority:'
                catleglabel = 'Failure Causes:'
                odstitle    = title
                nocatlabel
                nocurve
                nlegend;
run;
Colors from the ODS style are assigned to the bars based on levels of the BARS= variable. The chart is displayed in Output 15.4.1. The levels of the BARLEGEND= variable are the values that are displayed in the legend labeled "Priority:" at the bottom of the chart.
In general, when you specify BARS= and BARLEGEND= variables, their values must be consistent and unambiguous. Each observation that has a particular value of the process variable should have the same BARS= or BARLEGEND= variable value. For more information, see the entries for the BARS= and BARLEGEND= options in Dictionary of HBAR and VBAR Statement Options.