The PARETO Procedure
- Overview
-
Getting Started

-
Syntax
-
Details
-
ExamplesCreating Before-and-After Pareto ChartsCreating Two-Way Comparative Pareto ChartsHighlighting the "Vital Few"Highlighting Combinations of CategoriesHighlighting Combinations of CellsOrdering Rows and Columns in a Comparative Pareto ChartMerging Columns in a Comparative Pareto ChartCreating Weighted Pareto ChartsCreating Alternative Pareto ChartsCustomizing Inset Labels and Formatting ValuesSpecifying Inset Headers and PositionsManaging a Large Number of Categories
- References
Note: See Managing a Large Number of Categories in the SAS/QC Sample Library.
The Centers for Disease Control publish a variety of public health statistics. The numbers of deaths in 2010 in the United
States that were caused by various types of cancer are recorded in the SAS data set CancerDeaths2010:
data CancerDeaths2010;
   length Type $ 45;
   input Type & @47 Deaths comma7.;
   datalines;
Lip, oral cavity and pharynx                    8,474
Esophagus                                      14,490
Stomach                                        11,390
Colon, rectum and anus                         52,622
Liver and intrahepatic bile ducts              20,305
Pancreas                                       36,888
Larynx                                          3,691
Trachea, bronchus and lung                    158,318
Skin                                            9,154
Breast                                         41,435
Cervix                                          3,939
Uterus                                          8,402
Ovary                                          14,572
Prostate                                       28,561
Kidney and renal pelvis                        13,219
Bladder                                        14,731
Meninges, brain, other central nervous system  14,164
Hodgkin's disease                               1,231
Non-Hodgkin's lymphoma                         20,294
Leukemia                                       22,569
Multiple myeloma and immunoproliferative       11,428
Other lymphoid, hematopoietic and related          68
All other and unspecified                      64,798
;
The following statements produce a Pareto chart for the data in CancerDeaths2010:
proc pareto data=CancerDeaths2010;
   vbar Type / freq = Deaths;
run;
The resulting Pareto chart is shown in Output 15.12.1.
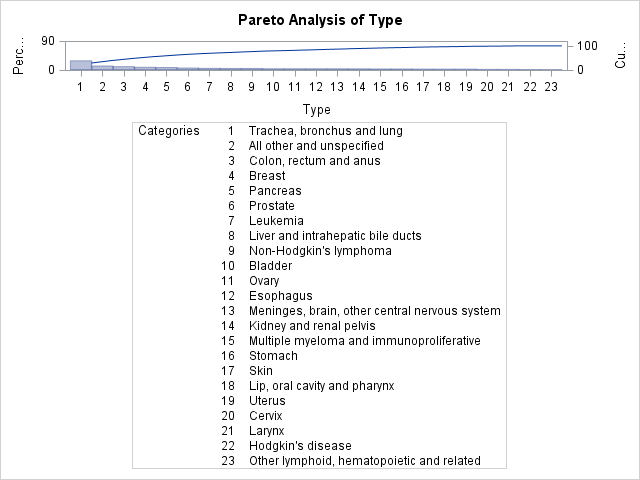
Note that PROC PARETO has labeled the category axis tick marks with numbers and produced a corresponding category legend. This is done by default when there is not enough room to use category names as tick labels on the category axis. Unfortunately, because some of the category names are long, the legend has room for only one column of entries and therefore occupies an inordinate amount of space. Among the alternatives for addressing this problem are the following:
-
replacing the original category names with shorter ones
-
increasing the space available for the graph
You can implement the second alternative by specifying the WIDTH= option in the ODS GRAPHICS statement prior to invoking the procedure. (The ODS GRAPHICS statement is documented in the SAS Output Delivery System: User's Guide.) Output 15.12.2 shows the Pareto chart that is produced after the graph width is increased.
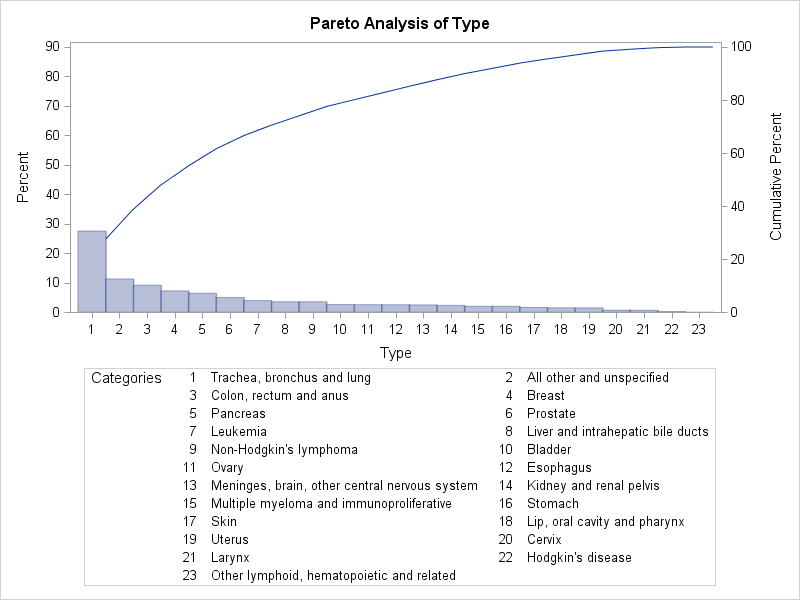
In a standard Pareto chart, the cumulative percentage curve is anchored at the top of the first category bar. In Output 15.12.2 PROC PARETO has automatically relaxed that rule to avoid excessive compression of the bars. You can use the FREQAXIS= option to specify that the frequency axis extend to 100%, which restores the anchoring of the curve. (For more information about scaling the frequency and cumulative percentage axes, see the section Scaling the Cumulative Percentage Curve.)
Note also in Output 15.12.2 that the category All other and unspecified has the second highest frequency. To better indicate the specific types of cancer responsible for the most deaths, you can
use the LAST=
option to display the All other and unspecified category last.
The following statements incorporate these changes and add other enhancements to the chart:
ods graphics / width=800px;
title 'U.S. Cancer Deaths in 2010 by Type';
proc pareto data=CancerDeaths2010;
   vbar Type / freq        = Deaths
               barlabel    = value
               last        = 'All other and unspecified'
               nocatlabel
               catleglabel = 'Cancer Type'
               freqaxis    = 0 to 100 by 10
               nlegend     = 'Total Cancer Deaths'
               odstitle    = title
               out         = CSummary;
               ;
run;
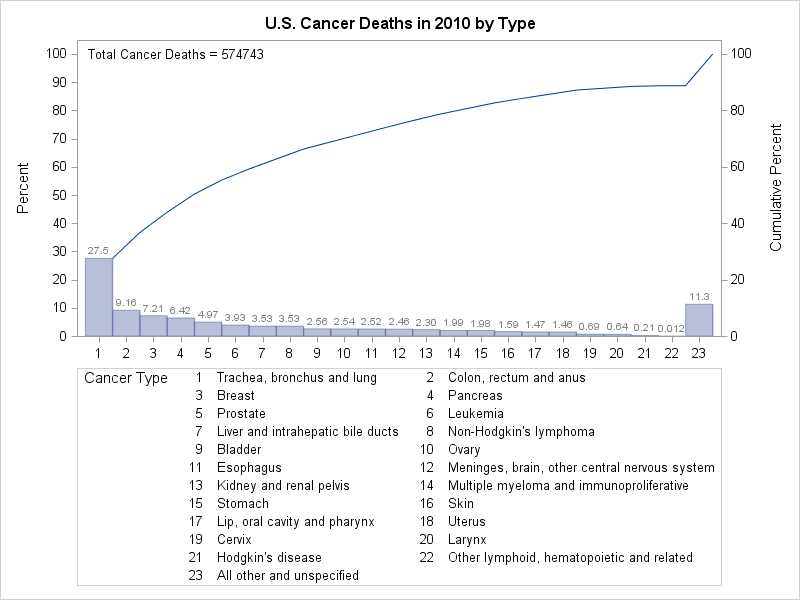
The BARLABEL=
option labels each bar with its value in frequency axis units, which in this case is the percentage of cancer deaths that
were caused by that type of cancer. The NOCATLABEL
option saves some space by eliminating the category axis label, and the CATLEGLABEL=
option produces a more informative label for the category legend. The NLEGEND=
option displays the total sample size with an appropriate label. The ODSTITLE=
option replaces the default graph title with the one specified in the TITLE statement. The OUT=
option saves a summary of the Pareto chart in the data set CSummary.
The improved Pareto chart is shown in Output 15.12.3, and a listing of CSummary is shown in Output 15.12.4.
Output 15.12.4: CSummary Data Set
| U.S. Cancer Deaths in 2010 by Type |
| Obs | Type | _COUNT_ | _PCT_ | _CMPCT_ |
|---|---|---|---|---|
| 1 | Trachea, bronchus and lung | 158318 | 27.5459 | 27.546 |
| 2 | Colon, rectum and anus | 52622 | 9.1557 | 36.702 |
| 3 | Breast | 41435 | 7.2093 | 43.911 |
| 4 | Pancreas | 36888 | 6.4182 | 50.329 |
| 5 | Prostate | 28561 | 4.9694 | 55.298 |
| 6 | Leukemia | 22569 | 3.9268 | 59.225 |
| 7 | Liver and intrahepatic bile ducts | 20305 | 3.5329 | 62.758 |
| 8 | Non-Hodgkin's lymphoma | 20294 | 3.5310 | 66.289 |
| 9 | Bladder | 14731 | 2.5631 | 68.852 |
| 10 | Ovary | 14572 | 2.5354 | 71.388 |
| 11 | Esophagus | 14490 | 2.5211 | 73.909 |
| 12 | Meninges, brain, other central nervous system | 14164 | 2.4644 | 76.373 |
| 13 | Kidney and renal pelvis | 13219 | 2.3000 | 78.673 |
| 14 | Multiple myeloma and immunoproliferative | 11428 | 1.9884 | 80.661 |
| 15 | Stomach | 11390 | 1.9818 | 82.643 |
| 16 | Skin | 9154 | 1.5927 | 84.236 |
| 17 | Lip, oral cavity and pharynx | 8474 | 1.4744 | 85.710 |
| 18 | Uterus | 8402 | 1.4619 | 87.172 |
| 19 | Cervix | 3939 | 0.6853 | 87.858 |
| 20 | Larynx | 3691 | 0.6422 | 88.500 |
| 21 | Hodgkin's disease | 1231 | 0.2142 | 88.714 |
| 22 | Other lymphoid, hematopoietic and related | 68 | 0.0118 | 88.726 |
| 23 | All other and unspecified | 64798 | 11.2743 | 100.000 |
The Pareto chart in Output 15.12.3 has 23 categories, some of which account for only a small percentage of the total deaths. Often only a relatively few categories that have the highest frequencies are of interest. The PARETO procedure provides options for limiting the number of categories that are displayed on a chart. For an example of restricting the number of categories by using the MAXNCAT= and OTHER= options, see the section Restricting the Number of Pareto Categories.
The original CancerDeaths2010 data set appears to have been summarized in advance, with the All other and unspecified category containing the total count for unspecified cancers plus those types that account for fewer deaths than the 22 distinct
types that are shown in Output 15.12.3. The All other and unspecified category has the second highest frequency, accounting for 11.3% of all deaths.
The chart statement options that limit the number of categories to be displayed omit or merge low-frequency categories. In
this case, it is more useful to merge the low-frequency categories into the existing All other and unspecified category. The following DATA step merges each type that accounts for less than 2% of cancer deaths into the All other and unspecified category:
data CSummary;
   set CSummary;
   if _PCT_ < 2.0 then Type='All other and unspecified';
run;
The modified CSummary data set is shown in Output 15.12.5.
Output 15.12.5: Modified CSummary Data Set
| U.S. Cancer Deaths in 2010 by Type |
| Obs | Type | _COUNT_ | _PCT_ | _CMPCT_ |
|---|---|---|---|---|
| 1 | Trachea, bronchus and lung | 158318 | 27.5459 | 27.546 |
| 2 | Colon, rectum and anus | 52622 | 9.1557 | 36.702 |
| 3 | Breast | 41435 | 7.2093 | 43.911 |
| 4 | Pancreas | 36888 | 6.4182 | 50.329 |
| 5 | Prostate | 28561 | 4.9694 | 55.298 |
| 6 | Leukemia | 22569 | 3.9268 | 59.225 |
| 7 | Liver and intrahepatic bile ducts | 20305 | 3.5329 | 62.758 |
| 8 | Non-Hodgkin's lymphoma | 20294 | 3.5310 | 66.289 |
| 9 | Bladder | 14731 | 2.5631 | 68.852 |
| 10 | Ovary | 14572 | 2.5354 | 71.388 |
| 11 | Esophagus | 14490 | 2.5211 | 73.909 |
| 12 | Meninges, brain, other central nervous system | 14164 | 2.4644 | 76.373 |
| 13 | Kidney and renal pelvis | 13219 | 2.3000 | 78.673 |
| 14 | All other and unspecified | 11428 | 1.9884 | 80.661 |
| 15 | All other and unspecified | 11390 | 1.9818 | 82.643 |
| 16 | All other and unspecified | 9154 | 1.5927 | 84.236 |
| 17 | All other and unspecified | 8474 | 1.4744 | 85.710 |
| 18 | All other and unspecified | 8402 | 1.4619 | 87.172 |
| 19 | All other and unspecified | 3939 | 0.6853 | 87.858 |
| 20 | All other and unspecified | 3691 | 0.6422 | 88.500 |
| 21 | All other and unspecified | 1231 | 0.2142 | 88.714 |
| 22 | All other and unspecified | 68 | 0.0118 | 88.726 |
| 23 | All other and unspecified | 64798 | 11.2743 | 100.000 |
Note that although CSummary contains frequency data, it can contain multiple observations that have the same category value. The following statements
create a Pareto chart from the modified CSummary data set:
proc pareto data=CSummary;
   vbar Type / freq        = _COUNT_
               last        = 'All other and unspecified'
               barlabel    = value
               nocatlabel
               catleglabel = 'Cancer Type'
               freqaxis    = 0 to 100 by 10
               odstitle    = title;
   inset n='Total Cancer Deaths:'(comma7.) / noframe;
run;
Note that the sample size legend in Output 15.12.3 displays the sample size as an unformatted integer. By using an INSET statement instead of the NLEGEND= option, you can specify a format for the sample size. (For a complete description of the INSET statement, see the section INSET Statement.) The resulting chart is shown in Output 15.12.6.
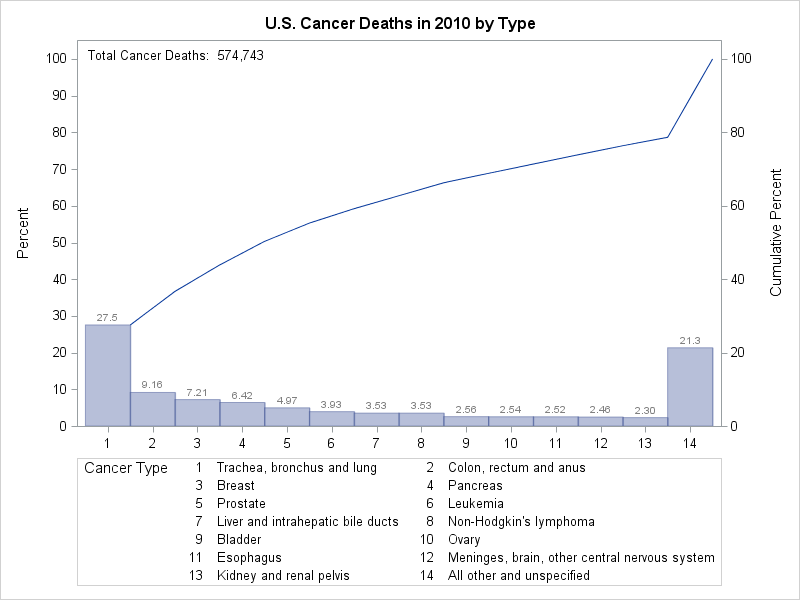
Output 15.12.6 shows that 21.3% of deaths are assigned to All other and unspecified and that the bar frequencies sum to 100%.