The PARETO Procedure
- Overview
-
Getting Started

-
Syntax
-
Details
-
ExamplesCreating Before-and-After Pareto ChartsCreating Two-Way Comparative Pareto ChartsHighlighting the "Vital Few"Highlighting Combinations of CategoriesHighlighting Combinations of CellsOrdering Rows and Columns in a Comparative Pareto ChartMerging Columns in a Comparative Pareto ChartCreating Weighted Pareto ChartsCreating Alternative Pareto ChartsCustomizing Inset Labels and Formatting ValuesSpecifying Inset Headers and PositionsManaging a Large Number of Categories
- References
This section provides details about three different methods of positioning insets using the POSITION= option. You can use the POSITION= option to specify the following:
-
compass points
-
keywords for margin positions
-
coordinates in data units or percentage axis units
Note: See Positioning Insets in Pareto Charts in the SAS/QC Sample Library.
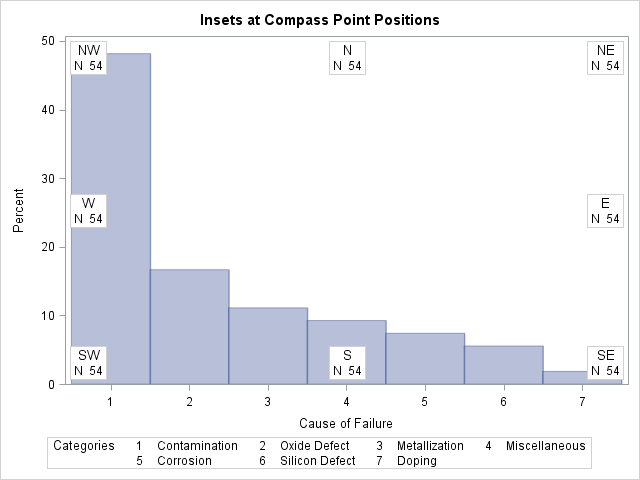
You can specify the eight compass points N, NE, E, SE, S, SW, W, and NW as keywords for the POSITION= option. The following statements create the display in Figure 15.9, which demonstrates all eight compass positions. The default is NW.
proc pareto data=Failure3;
   vbar Cause / freq     = Counts
                odstitle = "Insets at Compass Point Positions"
                nocurve
                ;
   inset n / cfill header='NW' pos=nw;
   inset n / cfill header='N ' pos=n ;
   inset n / cfill header='NE' pos=ne;
   inset n / cfill header='E ' pos=e ;
   inset n / cfill header='SE' pos=se;
   inset n / cfill header='S ' pos=s ;
   inset n / cfill header='SW' pos=sw;
   inset n / cfill header='W ' pos=w ;
run;
You can also use the margin keywords LM, RM, TM, or BM in the INSET statement to position an inset in one of the four margins that surround the plot area, as illustrated in Figure 15.10.
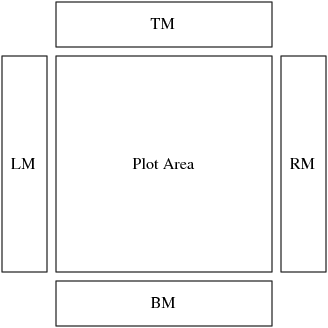
For an example of an inset placed in the right margin, see Output 15.11.1. You might want to place an inset in a margin if it contains a large number of entries (for example the contents of a data set that is specified in the DATA= keyword). If you attempt to display a lengthy inset in the interior of the plot, the inset is likely to collide with the data display.
Insets that are associated with a comparative Pareto chart cannot be positioned in the margins.
When you produce traditional graphics, you can also specify the position of the inset with coordinates by specifying POSITION=
![]() . The coordinates can be specified in axis percentage units (the default) or in axis data units.
. The coordinates can be specified in axis percentage units (the default) or in axis data units.
If you specify the DATA option immediately following the coordinates, the inset is positioned using axis data units. Data units along the category axis are based on category numbers. Categories are numbered from left to right (VBAR chart) or top to bottom (HBAR chart), starting with 1.
Note: See Positioning Insets in Pareto Charts in the SAS/QC Sample Library.
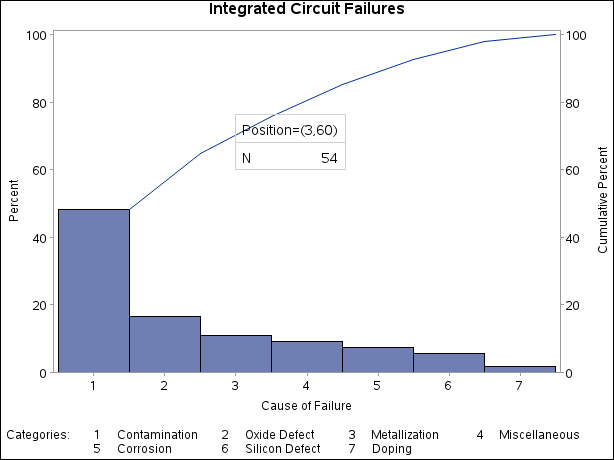
For example, the following statements produce the Pareto chart that is displayed in Figure 15.11:
ods graphics off;
title 'Integrated Circuit Failures';
proc pareto data=Failure3;
   vbar Cause / freq = Counts;
   inset n / header   = 'Position=(3,60)'
             position = (3,60) data
             height   = 3;
run;
The HEIGHT= option in the INSET statement specifies the text height that is used to display the statistics in the inset.
The bottom left corner of the inset is lined up with the tick mark for the third category on the horizontal axis and at 60 on the vertical axis. By default, the specified coordinates determine the position of the bottom left corner of the inset. You can change this reference point by specifying the REFPOINT= option, as shown in the next section.
Note: See Positioning Insets in Pareto Charts in the SAS/QC Sample Library.
If you do not use the DATA option, the inset is positioned using axis percentage units. The coordinates of the bottom left
corner of the display are ![]() , and the coordinates of the upper right corner are
, and the coordinates of the upper right corner are ![]() . For example, the following statements create a Pareto chart that has two insets, both positioned using coordinates in axis
percentage units.
. For example, the following statements create a Pareto chart that has two insets, both positioned using coordinates in axis
percentage units.
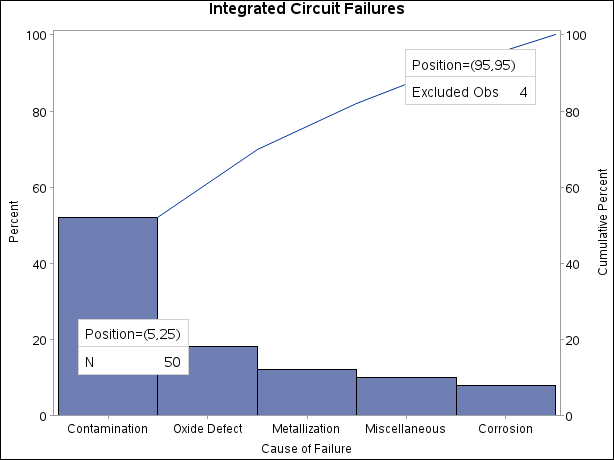
proc pareto data=Failure3;
   vbar Cause / freq     = Counts
                maxncat  = 5;
   inset n / position = (5,25)
             header   = 'Position=(5,25)'
             height   = 3
             cfill    = blank
             refpoint = tl;
   inset nexcl / position = (95,95)
                 header   = 'Position=(95,95)'
                 height   = 3
                 cfill    = blank
                 refpoint = tr;
run;
The chart is shown in Figure 15.12. Notice that the REFPOINT= option is used to determine which corner of the inset is to be placed at the coordinates that are specified in the POSITION= option. The first inset has REFPOINT=TL, so the top left corner of the inset is positioned 5% of the way across the horizontal axis and 25% of the way up the vertical axis. The second inset has REFPOINT=TR, so the top right corner of the inset is positioned 95% of the way across the horizontal axis and 95% of the way up the vertical axis. Coordinates in axis percentage units must be between 0 and 100.