GBARLINE Procedure

Example 3: Specifying Subgroups, Multiple Plots, Data Tips, and Drill-Down URLs
| Features: |
Multiple PLOT statements: SUMVAR= |
| Other features: |
ODS statement option: STYLE= AXIS statements LEGEND statements ODS HTML statement SYMBOL statement |
| Data set: | SASHELP.ELECTRIC |
| Sample library member: | GBLPOWER |
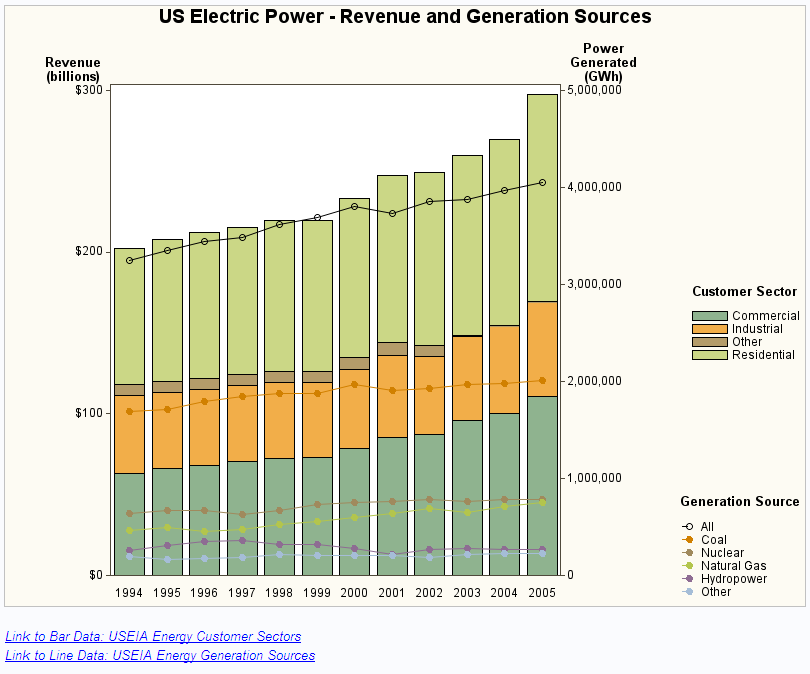
This graph shows the total amount of power
generated by six different energy sources in the US during the years
1994 to 2005. It also shows the revenue received from four different
customer sectors during these same years.
The power generated
is graphed as a subgrouped bar chart. The chart variable is YEAR,
and the subgroup variable is CUSTOMER, the customer sector. The program
also specifies the DISCRETE option, so each year's data is graphed
as a separate midpoint. The subgroups create a separate segment in
the bar for each year, and the height of each bar represents the total
revenue for that year for all customer sectors.
The power generated
from each energy source is plotted as six different line plots. Each
of the six plot lines represents a different energy source.
Separate legends are
created for the bar chart and the line plots. By specifying the LEGEND
POSITION= option, the legend for the bar chart is displayed at the
top middle of the graph. The legend for the plots is displayed at
the bottom right of the graph.
The colors used for
everything except the plot lines is controlled by the style. The example
specifies the Analysis style.
This example defines
data tip text for both the plot symbols and the bar chart segments.
It defines drill-down URLs for the entries in the footnotes.
Program
goptions reset=all border;
ods html style=analysis gtitle nogfootnote;
title1  "US Electric Power - Revenue and Generation Sources";

footnote1  j=l italic
           link="http://www.eia.doe.gov/cneaf/electricity/epa/epat7p3.html"
           "Link to Bar Data: USEIA Energy Customer Sectors";

footnote2 j=l italic
          link="http://www.eia.doe.gov/cneaf/electricity/epa/epat1p1.html"
          "Link to Line Data: USEIA Energy Generation Sources" ;
axis1 label=(j=c "Revenue" j=c "(billions)") minor=none; /* left */
axis2 label=(j=c "Power" j=c "Generated" j=c "(GWh)") minor=none; /* right */
axis3 label=none; /* bottom */
/* Bar legend */
legend1 position=(middle right outside)  across=1
        label=(position=(top )  j=l "Customer Sector");
/* Line plot legend */
legend2 position=(bottom right outside) across=1 repeat=1
        label=(position=(top) j=l  "Generation Source") ;
symbol1 c=black value=circle;
symbol2 value=dot;
proc gbarline data=sashelp.electric;
   bar year / discrete sumvar=Revenue subgroup=Customer
              raxis=axis1 maxis=axis3 legend=legend1
              html=revtip name="US_Electric_Power"
              des="Chart of US Electricity Generation Sources and Consumers";

   plot / sumvar=AllPower   html=alltip legend=legend2 axis=axis2;
   plot / sumvar=Coal       html=coaltip;
   plot / sumvar=Nuclear    html=nuketip;
   plot / sumvar=NaturalGas html=gastip;
   plot / sumvar=Hydro      html=hydrotip;
   plot / sumvar=Other      html=othertip;
run;
quit;
Program Description
Set the HTML options. The
GTITLE option causes the title to be rendered as part of the graph
image instead of being created by the HTML code as text. Alternatively,
the NOGFOOTNOTE option causes the footnote to be created by the HTML
file as text instead of being rendered as an image with the rest of
the graph. Notice that, as a result, the TITLE appears within the
graph frame, but the footnotes appear outside the frame. You might
also use the ODS PATH= and FILE= options to specify a location for
the output files.
Define the title and footnotes. The LINK= option in the FOOTNOTE statement defines
drill-down URLs for the source of the information.
title1  "US Electric Power - Revenue and Generation Sources";

footnote1  j=l italic
           link="http://www.eia.doe.gov/cneaf/electricity/epa/epat7p3.html"
           "Link to Bar Data: USEIA Energy Customer Sectors";

footnote2 j=l italic
          link="http://www.eia.doe.gov/cneaf/electricity/epa/epat1p1.html"
          "Link to Line Data: USEIA Energy Generation Sources" ;
Define the labels for the axes. The AXIS1 statement defines the axis properties
for the bar response (left) axis. The AXIS2 statement defines the
properties for the plot response (right) axis. The AXIS3 statement
is used to suppress the default label on the midpoint axis.
axis1 label=(j=c "Revenue" j=c "(billions)") minor=none; /* left */
axis2 label=(j=c "Power" j=c "Generated" j=c "(GWh)") minor=none; /* right */
axis3 label=none; /* bottom */
Specify options for the bar and plot legends. Use different LEGEND statements and position the
legends in different places for the bar chart and the overlay plots.
This causes GBARLINE to produce two separate legends instead of combining
the legends into one.
/* Bar legend */
legend1 position=(middle right outside)  across=1
        label=(position=(top )  j=l "Customer Sector");
/* Line plot legend */
legend2 position=(bottom right outside) across=1 repeat=1
label=(position=(top) j=l "Generation Source") ;Produce the bar-line chart. This
graph uses the data set entitled ELECTRIC found in the SASHELP library.
The SUMVAR= option in the BAR statement specifies the variable that
determines the height of the bars. The SUMVAR= option in the PLOT
statement specifies the plot variable. The HTML= options associate
data tip text with the bars and plot points.
proc gbarline data=sashelp.electric;
   bar year / discrete sumvar=Revenue subgroup=Customer
              raxis=axis1 maxis=axis3 legend=legend1
              html=revtip name="US_Electric_Power"
              des="Chart of US Electricity Generation Sources and Consumers";

   plot / sumvar=AllPower   html=alltip legend=legend2 axis=axis2;
   plot / sumvar=Coal       html=coaltip;
   plot / sumvar=Nuclear    html=nuketip;
   plot / sumvar=NaturalGas html=gastip;
   plot / sumvar=Hydro      html=hydrotip;
   plot / sumvar=Other      html=othertip;
run;
quit;