GBARLINE Procedure

Example 2: Calculating Weighted Statistics
| Features: |
|
| Other features: |
AXIS statement |
| Data set: | SASHELP.FAILURE |
| Sample library member: | GBLWTSTA |
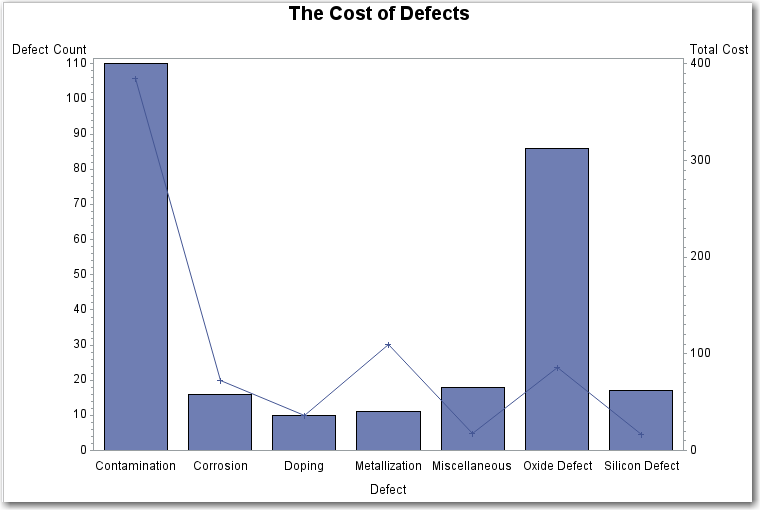
This example uses the FREQ= option to calculate weighted
statistics for the line plot. During the manufacture of a metal-oxide
semiconductor (MOS) capacitor, various defects and their frequencies
were recorded.
Program
goptions reset=all border;
data myfail;
   set sashelp.failure;
   label Cause='Defect';
    select (Cause) ;
      when ("Contamination")  Cost=3.5;
      when ("Metallization")  Cost=10;
      when ("Oxide")          Cost=10.5;
      when ("Corrosion")      Cost=4.5;
      when ("Doping")         Cost=3.6;
      when ("Silicon")        Cost=5.4;
      otherwise               Cost=1.0;
    end;
run;
title1 "The Cost of Defects";
axis1 label=("Defect Count");
axis2 label=("Total Cost");
proc gbarline data=myfail;
   bar Cause / sumvar=Count axis=axis1;
   plot / sumvar=Count freq=cost axis=axis2;
run;
quit;
Program Description
This graph uses the data set entitled FAILURE found in
the SASHELP library. Each observation of the FAILURE data set contains
the type of manufacturing defect and a count of how many times it
occurred. Define data that associates a cost with each defect. Assign
a label of 'Defect' in place of the variable name in the data set.
data myfail;
   set sashelp.failure;
   label Cause='Defect';
    select (Cause) ;
      when ("Contamination")  Cost=3.5;
      when ("Metallization")  Cost=10;
      when ("Oxide")          Cost=10.5;
      when ("Corrosion")      Cost=4.5;
      when ("Doping")         Cost=3.6;
      when ("Silicon")        Cost=5.4;
      otherwise               Cost=1.0;
    end;
run;
Produce the bar-line chart.The
SUMVAR= option in the BAR statement specifies the variable that determines
the height of the bars. The SUMVAR= option in the PLOT statement specifies
the plot variable, in this case the Cause of Failure, or Defect..
GBARLINE multiplies the value of the FREQ= variable (cost assigned)
by the value of the COUNT variable, and uses the result to determine
the plot points.