GBARLINE Procedure

Example 1: Producing a Basic Bar-Line Chart
| Features: |
BAR and PLOT statement options: SUMVAR= |
| Sample library member: | GBLSTOCK |
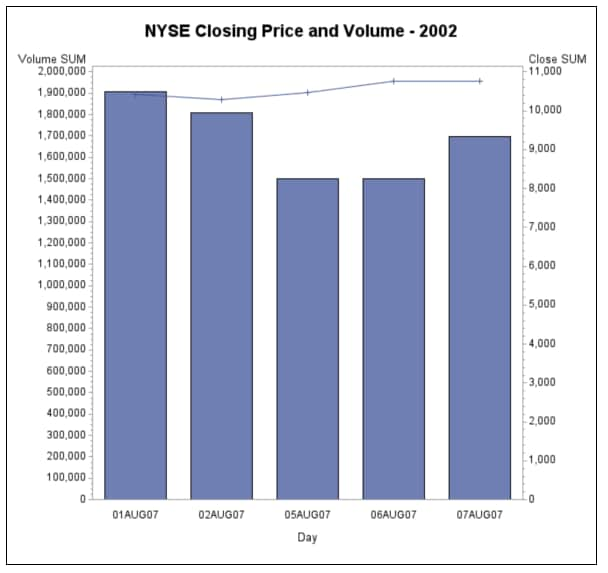
This
example produces a basic bar-line chart showing the volume and closing
price for each of five days of trading activity on the New York Stock
Exchange. The vertical bars indicate the volume using the left (chart)
response axis, and the line plot shows the closing price. This graph
uses the statistical style.
Program
goptions reset=all border;
title1 "NYSE Closing Price and Volume - 2002";
data nyse;
   format Day date7.;
   format High Low Close comma12.;
   format Volume comma12.;
   input Day date7. High Low Close Volume;

datalines;
01AUG07 10478.76 10346.24 10426.91 1908809
02AUG07 11042.92 10298.44 10274.65 1807543
05AUG07 10498.22 10400.31 10456.43 1500656
06AUG07 10694.47 10636.32 10762.98 1498403
07AUG07 10801.12 10695.13 10759.48 1695602
run;
proc gbarline data=nyse;
bar day / discrete sumvar=volume space=4;
plot / sumvar=close;
run;
quit;
Program Description
Set the graphics environment. Some
graphics options might override style attributes, so if you are using
a style, specify the minimum graphic options needed by your graph.
Create the data set NYSE. NYSE
contains one observation for each of five workdays. Each observation
includes the date, closing price, and volume.
data nyse;
   format Day date7.;
   format High Low Close comma12.;
   format Volume comma12.;
   input Day date7. High Low Close Volume;

datalines;
01AUG07 10478.76 10346.24 10426.91 1908809
02AUG07 11042.92 10298.44 10274.65 1807543
05AUG07 10498.22 10400.31 10456.43 1500656
06AUG07 10694.47 10636.32 10762.98 1498403
07AUG07 10801.12 10695.13 10759.48 1695602
run;