GPLOT Procedure
- Syntax

- Overview
- Concepts
- Examples Generating a Simple Bubble PlotLabeling and Sizing Plot BubblesAdding a Right Vertical AxisPlotting Two VariablesConnecting Plot Data PointsGenerating an Overlay PlotFilling Areas in an Overlay PlotPlotting Three VariablesPlotting with Different Scales of ValuesCreating Plots with Drill-down Functionality for the Web
PLOT2 Statement
Produces one or more plots with the vertical axis
on the right side of the graph against which a second variable can
be plotted.
| Requirement: | You cannot use the PLOT2 statement alone. It can be used only with a PLOT or BUBBLE statement. At least one plot request is required. |
| Global statements: | AXIS, FOOTNOTE, LEGEND, PATTERN, SYMBOL, TITLE |
Syntax
PLOT2 plot-request(s) </option(s)>;
Summary of Optional Arguments
Appearance options
specifies a data set to annotate all graphs that
are produced by the GPLOT procedure.
specifies the color for the axis line and all major
and minor tick marks.
fills the axis area with the specified color.
specifies the color of the outline that is drawn
around filled areas.
specifies a color for all text on the axes and legend,
including axis labels, tick mark values, legend labels, and legend
value descriptions.
specifies whether a
line is drawn around the axis area.
specifies that reference lines drawn by the AUTOREF
or REF= options should be drawn in front of the bars.
suppresses the axes, including axis lines, axis
labels, all major and minor tick marks, and tick mark values.
ODS options
identifies
the variable in the input data set whose values create links.
identifies
the variable in the input data set whose values create links or data
tips or both.
Plot options
fills all the areas below plot line n with
a pattern.
draws reference lines at all major tick marks on
both axes.
generates a legend or specifies the legend to use
for the plot.
removes the last area of a plot when the value specified
by the AREAS= option exceeds the number of bounded areas in the plot.
suppresses the legend that is generated by a plot
request of the type y-variable*x-variable=third-variable.
places all the plots that are generated by the PLOT
statement on one set of axes.
displays the regression equation that is specified
in the INTERPOL= option of the SYMBOL statement in the lower left
corner of the plot.
breaks a plot line or an area fill at occurrences
of missing values of the Y variable.
Vertical axis options
draws reference lines at all of the major tick marks
on the vertical axis.
specifies the color of reference lines drawn at
major tick marks on the vertical axis, as determined by the AUTOVREF
option.
specifies the color of reference lines drawn perpendicular
to the vertical axis.
specifies a line type for reference lines drawn
at major tick marks on the vertical axis, as specified by the AUTOVREF
option.
specifies the type of reference lines drawn with
the AUTOVREF, VREF, and GRID options.
specifies the major tick mark values for the vertical
axis or assigns an axis definition.
specifies the number of minor tick marks that are
drawn between each major tick mark on the vertical axis.
draws one or more reference lines perpendicular
to the vertical axis at specified points.
specifies that the order of the values on the vertical
axis be reversed.
specifies that tick marks on the vertical axis begin
in the first position with a zero.
specifies the line width for all reference lines
at major tick marks on the vertical axis as determined by the AUTOVREF
option.
specifies line widths for reference lines as determined
by the vertical axis.
Required Argument
- plot-request(s)
-
each specifies the variables to plot and produces a separate graph, unless you specify the OVERLAY option. All variables must be in the input data set. Multiple plot requests are separated with blanks. A plot request can be any of these:
- y-variable*x-variable<=n>
-
plots the values of two variables and can assign a SYMBOL definition to the plot.
- (y-variable(s))*(x-variable(s))
-
plots the values of two or more variable and produces a separate graph for each combination of Y and X variables.
- y-variable*x-variable=third-variable
-
plots the values of two variables against a third classification variable
For more information about plot requests, see PLOT Statement.
Optional Arguments
- ANNOTATE=Annotate-data-set
- specifies a data set to annotate all graphs that
are produced by the GPLOT procedure. To annotate individual
graphs created using a By statement or multiple action statements,
use ANNOTATE= in the action statement.Alias:ANNO=
- AREAS=n
- fills all the areas below plot line n with
a pattern. The value of n specifies
which areas to fill:
If you specify a value for the AREAS= option that is greater than the number of bounded areas in the plot, the area between the top plot line and the axis frame is filled.Before an area can be filled, the data points that border the area must be joined by a line. Use a SYMBOL statement with one of these interpolation methods to join the data points:See the SYMBOL Statement for details about interpolation methods.By default, the AREAS= option fills areas by rotating a solid fill through the list of colors defined in the current style. If the NOGSTYLE option is specified, the areas are filled by rotating a solid fill through the device's color list. If the graph needs more patterns, it rotates hatch patterns, beginning with the M2N0 pattern. See the PATTERN Statement for more information about map and plot patterns. However, if color is limited to a single color with the CPATTERN= or COLORS= graphic options, the solid pattern is skipped and the first default pattern is M2N0. If the COLORS= graphic option specifies a single color, use as many SYMBOL statements as you have areas to fill because the INTERPOL= setting does not automatically apply to multiple symbol definitions.You can alter the default pattern behavior by specifying patterns and colors on PATTERN statements that specify map and plot patterns. A separate PATTERN definition is needed for each specified area.If you specify the PATTERN statements, the AREAS= option uses the lowest numbered PATTERN statement first. If it runs out of patterns, it uses the default behavior for map and plot patterns. See the PATTERN Statement for details.Pattern definitions are assigned to the areas below the plot lines in the order the plots are drawn. The first area is that between the horizontal axis and the plot line that is drawn first. The second area is that above the first plot line and below the plot line that is drawn second, and so on. If the line that is drawn second lies below the line that is drawn first, the second area is hidden when the first is filled. The plots with the lower line values must be drawn first to prevent one area fill from overlaying another. If the lines cross, only the part of an area that is above the previous line is visible.Therefore, when creating multiple plots in combination with the OVERLAY option, the PLOT statements must be ordered so that the plot request that produces the lowest line value is first (leftmost), the plot request that produces the next lowest line value is second plot request, and so on.If you produce multiple plots with a y-variable*x-variable=third-variable plot request, the lines are plotted in order of increasing third variable values. In that case, you must recode your data so that the lowest value of the third variable produces the lowest plot line, the next lowest value produces the next lowest plot line, and so on.If you use the VALUE= option in the SYMBOL statement, some symbols might be hidden. If you also specify reference lines with the AREAS= option, they are drawn behind the pattern fill.If you use the AREAS= option to fill the areas between your plots and you use the JAVA device to generate the plot, when you move your mouse pointer over a filled area in the plot output, a tooltip shows the values for the last observation in the data set for the group that the area represents. However, when you position your mouse pointer over a data point on a plot line, a tooltip shows the value for that point. This might confuse your viewers. To help avoid confusion in that case, you can turn off the tooltips by specifying the following on your ODS statement:
parameters=("Tips"="NONE")Restriction:Partially supported by JavaNotes:The AREAS= option works only if all plot lines are generated by the same PLOT or PLOT2 statement.If you have specified the NOGSTYLE option and the first color in your device's default color list is black, color rotation begins with the second color in the list. That is, there are no solid black patterns. See How Default Patterns and Outlines Are Generated for more information.
Example:Filling Areas in an Overlay Plot
- AUTOVREF
- draws reference lines at all of the major tick marks on the vertical axis. If you also use the AREAS= option, the filled areas cover the reference lines. To draw lines on top of the filled areas, use the FRONTREF option in either the PROC GPLOT statement or the PLOT statement. LAUTOVREF=, CAUTOVREF=, and WAUTOVREF= options can be used to change the line types, colors, and widths of these reference lines. To specify labels for these reference lines, use the VAXIS= option.
- CAUTOVREF=reference-line-color
- specifies the color of reference lines drawn at major tick marks on the vertical axis, as determined by the AUTOVREF option. If you do not specify the CAUTOVREF option, the default color is the value of the CAXIS= option. If neither option is specified, the default color is retrieved from the current style or from the device's color list if the NOGSTYLE option is specified.
- CAXIS=axis-color
- specifies the color for the axis line and all major
and minor tick marks. The default color is
retrieved from the current style or from the device's color list if
the NOGSTYLE option is specified.Alias:CA=
- CFRAME=background-color
- fills the axis area with the specified color. If the FRAME option
is also in effect, the procedure determines the color of the frame
around the axis area according to the precedence list given within
the FRAME option description.Style reference:Color attribute of the GraphWalls elementRestriction:CFRAME= is overridden by the NOFRAME and IFRAME= options. If the IFRAME= option is in effect, an image appears in the axis area instead of the color.
- COUTLINE=outline-color
- specifies the color of the outline that is drawn
around filled areas. The filled areas are
generated when the SYMBOL statement specifies INTERPOL=map/plot-pattern or the GOPTIONS statement
specifies INTERPOL. The default outline color is specified
in the current style. However, if the NOGSTYLE option is specified,
then the default color is the first color in the device's color list
(the foreground color), and the default slice outline color is determined
as follows: Style reference:Color attribute of the GraphOutlines elementRestriction:Not supported by Java
- CTEXT=text-color
- specifies a color for all text on the axes and legend,
including axis labels, tick mark values, legend labels, and legend
value descriptions. The GPLOT procedure
searches for a color specification in this order:
-
colors specified for labels and values on assigned AXIS and LEGEND statements, which override the CTEXT= option specified in the PLOT statement
-
the color specified by the CTEXT= option in the PLOT statement
-
the color specified by the CTEXT= option in the GOPTIONS statement
-
the color specified in the current style, or, if the NOGSTYLE option is specified, then the default color is black for the Java and ActiveX devices and the first color in the color list for all other devices
The LEGEND statement's VALUE= color is used for legend values, and its LABEL= color is used for legend labels.The AXIS statement's VALUE= color is used for axis values, and its LABEL= color is used for axis labels. However, if the AXIS statement specifies only general axis colors with its COLOR= option, the CTEXT= color overrides the general COLOR= specification and is used for axis labels and values. The COLOR= color is still used for all other axis colors, such as tick marks.Alias:C=Style reference:Color attributes of the GraphValueText and the GraphLabelText elementsNote:If you use a BY statement in the procedure, the color of the BY variable labels is controlled by the CBY= option in the GOPTIONS statement. -
- CVREF=reference-line-color | (reference-line-color) | (reference-line-color-list)
- specifies the color of reference lines drawn perpendicular
to the vertical axis. This option affects
reference lines drawn with the AUTOVREF, VREF, and GRID options. Specifying
a single color without parentheses applies that color to all reference
lines. The CAUTOVREF= option overrides the CVREF= option for lines
drawn with the AUTOVREF option. Specifying a single color in parentheses
applies that color only to the first reference line drawn with the
VREF= option. Specifying a color list applies colors sequentially
to successive reference lines drawn with the VREF= option. The syntax
of the color list requires parentheses and colors separated by spaces
(color1 color2... colorN).
If you do not specify the CVREF= option, the GPLOT procedure uses
the color specified by the CAXIS= option. If neither option is specified,
the default color is retrieved from the current style of from the
first color in the color list if the NOGSTYLE option is specified.Alias:CV=Style reference:Color attribute of the GraphGridLines element
- FRAME | NOFRAME
- specifies whether a
line is drawn around the axis area. The default is FRAME.
If you also use a BUBBLE2 or PLOT2 statement and these plotting statements
have conflicting frame specifications, FRAME is used as opposed to
NOFRAME.
-
the CAXIS= option
-
the COLOR= option in the AXIS definition assigned to the vertical axis
-
the COLOR= option in the AXIS definition assigned to the horizontal axis
-
the default, which is the color defined by the current style
Alias:FR | NOFR= -
- FRONTREF
- specifies that reference lines drawn by the AUTOREF or REF= options should be drawn in front of the bars. By default, reference lines are drawn on the back plane of the axis.
- GRID
- draws reference lines at all major tick marks on both axes. The line color is the color of the axis. When specified in a PLOT2 statement, the reference lines are drawn on the vertical axis on the right side of the plot.
- HTML=variable
- identifies
the variable in the input data set whose values create links or data
tips or both.
The variable values are either links or data tips or both that are
created in the HTML file generated by the ODS statement. The links are URLs pointing to Web pages to display when
the user clicks (drills down) on elements in the graph. Data tips
are detailed information or data values that are displayed as pop-up
text when a mouse pointer is positioned over elements in the graph.For Java and ActiveX, the PLOT statement is partially supported by the JAVA and ACTIVEX devices, and fully supported by the JAVAIMG and ACTXIMG devices, and the PLOT2 statement is supported only by the ACTXIMG device.Restriction:Partially supported by Java and ActiveX
Adding Links and Enhancements with the URL=, HTML=, and HTML_LEGEND= Options
- HTML_LEGEND=variable
- identifies
the variable in the input data set whose values create links. Input
data set variable values create links that are associated with a legend
value and point to the URL to display when the user clicks (drills
down) on the value. Restriction:Not supported by Java and ActiveX
- LAUTOVREF=reference-line-type
- specifies a line type for reference lines drawn
at major tick marks on the vertical axis, as specified by the AUTOVREF
option. The reference-line-type value
can be a whole number from 1 to 46. A value of 1 specifies a solid
line; values 2 through 46 specify dashed lines. The default line type
is retrieved from the current style, or if the NOGSTYLE option is
specified, the default value is 1, which draws a solid line.Style reference:LineStyle attribute of the GraphGridLines element
- LEGEND | LEGEND=LEGEND<1...99>
- generates a legend or specifies the legend to use
for the plot.
-
a PLOT statement that includes the OVERLAY option does not automatically generate a legend. In these plot types, use LEGEND to produce a default legend, or LEGEND=LEGENDn to assign a defined LEGEND statement to the plot. The default legend is centered below the axis frame and identifies which colors and plot symbols represent the y-variables that you specify for the plots. To control the order of the legend entries for overlaid plots, use the ORDER= option in the LEGEND statement and specify the list of variables in quotation marks in the preferred order. For example, the following causes the legend entry for y3 to be displayed first, y1 next, and y2 last:
legend1 order=('y3' 'y1' 'y2');
proc gplot data=mydata2;
plot (y1 y2 y3)*x / overlay  legend=legend1;
run;
For more information about the ORDER= option see ORDER=(value-list) | DESCENDING in the LEGEND statement. -
a plot request of the form y-variable*x-variable=third-variable automatically generates a default legend that identifies which colors and plot symbols represent each value of the classification variable. In these plot types, override the default by using LEGEND=LEGENDn to assign a defined LEGEND statement to the plot.
If you use the SHAPE= option in a LEGEND statement, the value SYMBOL is valid. If you use the PLOT statement's AREAS= option, SHAPE=BAR is also valid.See:LEGEND StatementExample:Generating an Overlay Plot -
- LVREF=reference-line-type | (reference-line-type) | (reference-line-type-list)
- specifies the type of reference lines drawn with
the AUTOVREF, VREF, and GRID options. The reference-line-type value
can be a whole number from 1 to 46. A value of 1 specifies a solid
line; values 2 through 46 specify dashed lines. This option affects
reference lines drawn with the AUTOVREF, VREF, and GRID options. Specifying
a single line type without parentheses applies that line type to all
reference lines. The LAUTOVREF= option overrides the LVREF= option
for lines drawn with the AUTOVREF option. Specifying a single line
type in parentheses applies that line type only to the first line
drawn with the VREF= option. Specifying a line-type list applies line
types in sequence to successive reference lines drawn with the VREF=
option. The
syntax of the line type list requires parentheses and line types separated
by spaces (type1 type2... typeN).
The default line type is retrieved from the current style, or if the
NOGSTYLE option is specified, the default value is 1, which draws
a solid line. To specify colors for these references lines, use the
CVREF= option. To specify labels for these reference lines, use the
VAXIS= option.For needle plots that are generated with a Java or ActiveX device driver, the value of the LVREF= option is not applied to the default reference line that is drawn at zero when the minimum value of the vertical axis is less than zero. This line is solid (not dashed).Alias:LV=Style reference:LineStyle attribute of the GraphGridLines elementRestriction:Partially supported by Java and ActiveXExample:Connecting Plot Data Points
- NOAXIS
- suppresses the axes, including axis lines, axis
labels, all major and minor tick marks, and tick mark values. Alias:NOAXES
- NOLASTAREA
- removes the last area of a plot when the value specified
by the AREAS= option exceeds the number of bounded areas in the plot. The last area is the
area between the last plot line and the axis frame. You can use the
NOLASTAREA option in PLOT and PLOT2 statements. However, when both
PLOT and PLOT2 statements exist, the NOLASTAREA option is ignored
in the PLOT statement. The NOLASTAREA option is also ignored in both
PLOT and PLOT2 statements when the AREAS= option is not specified
or when the number of bounded areas in the plot is less than or equal
to the value specified by the AREAS= option.Alias:NOLASTFILLRestriction:Not supported by Java and ActiveX.Note:Certain conditions related to the PLOT2 statement might result in variations in the behavior of the NOLASTAREA option.See:AREAS=n
- NOLEGEND
- suppresses the legend that is generated by a plot request of the type y-variable*x-variable=third-variable.
- OVERLAY
- places all the plots that are generated by the PLOT
statement on one set of axes. The axes are scaled
to include the minimum and maximum values of all of the variables,
and the variable names or labels associated with the first pair of
variables label the axes.The OVERLAY option produces a legend if you include the LEGEND or the LEGEND=n option in the PLOT statement.OVERLAY is not enabled with plot requests of the form y-variable*x-variable=third-variable. However, you can achieve an overlay effect by using a PLOT and PLOT2 statement.When generating output for the Web with the JAVA, JAVAMETA, or JAVAIMG device drivers, the OVERLAY option cannot be used in the PLOTor PLOT2 statement under these conditions:Restriction:Partially supported by JavaExamples:Generating an Overlay Plot
- REGEQN
- displays the regression equation that is specified
in the INTERPOL= option of the SYMBOL statement in the lower left
corner of the plot. You cannot modify the
format that is used for the equation.The GPLOT regression equation is computed from the screen coordinates of the markers. Therefore, a graph might not be displayed if the chart area for the plot becomes so small that markers cannot be drawn because there are no coordinates from which to build the regression equation. In such cases, the regression equation is no longer meaningful.Restriction:Not supported by ActiveXExample:Plotting Two Variables
- SKIPMISS
- breaks a plot line or an area fill at occurrences of missing values of the Y variable. By default, plot lines and area fills are not broken at missing values. The SKIPMISS option is available only with JOIN interpolation. If the SKIPMISS option is used, observations should be sorted by the independent (horizontal axis) variable. If the plot request is y-variable*x-variable=third-variable, observations should also be sorted by the values of the third variable.
- VAXIS=value-list | AXIS<1...99>
- specifies the major tick mark values for the vertical
axis or assigns an axis definition. For a description of value-list see HAXIS=value-list | AXIS<1 . . . 99> for the PLOT
statement. To assign labels to reference lines,
use an axis definition that contains the REFLABEL= option. The labels
are applied in sequence to all reference lines defined with the AUTOVREF
and VREF= options.For Web output that is generated with a Java or ActiveX device driver, certain options of the AXIS statement are not supported. For details, see the AXIS Statement.Restriction:Partially supported by Java and ActiveXExamples:Plotting Two Variables
- VMINOR=number-of-minor-ticks
- specifies the number of minor tick marks that are
drawn between each major tick mark on the vertical axis. Minor tick marks are
not labeled. The VMINOR= option overrides the NUMBER= suboption of
the MINOR= option in an AXIS definition. You must specify a positive
number.Alias:VM=Example:Labeling and Sizing Plot Bubbles
- VREF=value | (value) | (value-list)
- draws one or more reference lines perpendicular
to the vertical axis at specified points. For a description of value-list see HAXIS=value-list | AXIS<1 . . . 99> for the PLOT
statement. If the AREAS= option is also used,
the filled areas cover the reference lines. To draw lines on top of
the filled areas, use the FRONTREF option. LVREF=, CVREF=, and WVREF=
options can be used to change the line types, colors, and widths of
these reference lines. To specify labels for these reference lines,
use the VAXIS= option.Example:Connecting Plot Data Points
- VZERO
- specifies that tick marks on the vertical axis begin in the first position with a zero. The VZERO request is ignored if the vertical variable either contains negative values or has been ordered with the VAXIS= option or the ORDER= option in an AXIS statement.
- WAUTOVREF=reference-line-widtht
- specifies the line width for all reference lines
at major tick marks on the vertical axis as determined by the AUTOVREF
option. Line widths are specified
as whole numbers with the default value being 1. To specify a color for these reference lines, use the option CAUTOVREF=reference-line-color.Style reference:LineThickness attribute of the GraphGridLines element
- WVREF=reference-line-width | (reference-line-width) | (reference-line-width-list)
- specifies line widths for reference lines as determined
by the vertical axis. Line widths are specified
as whole numbers. Specifying a line width without parentheses applies
that type to all reference lines drawn with the AUTOVREF and VREF=
options. Note that the WAUTOVREF= option overrides WVREF=reference-line-width for
reference lines drawn with the AUTOREF option. Specifying a single
line width in parentheses applies that line width to the first reference
line drawn with the VREF= option. Specifying a line width list applies
line widths in sequence to successive reference lines drawn with the
VREF= option.
The syntax of the line-width list requires parentheses and line widths
separated by spaces (width1 width2 ...widthN).
The default line width is specified by the current style or by the
AXIS statement's WIDTH= option. (By default, WIDTH=1.) .To specify a color for these reference lines, use the option CVREF=reference-line-color | (reference-line-color) | (reference-line-color-list).Style reference:LineThickness attribute of the GraphGridLines element
Details
Options
Options for
the PLOT2 statement are identical to the options for the PLOT statement
except for these options, which are ignored if you specify them:
See PLOT Statement for descriptions of options that you can use with the PLOT2
statement.
Description
The PLOT2 statement
specifies one or more plot requests that name the horizontal and right
vertical axis variables. This statement automatically does the following:
You can use statement
options to manipulate the axes and modify the appearance of your graph.
You can use SYMBOL definitions to modify plot symbols for the data
points, join data points, draw regression lines, plot confidence limits,
or specify other types of interpolation. For more information
about the SYMBOL statement see About SYMBOL Definitions.
Matching Plot Requests
Matching Requests between PLOT and PLOT2 Statements
The plot requests in both the
PLOT and PLOT2 statements must be evenly matched as in this example:
plot  y*x  b*a;
    plot2 y2*x b2*a;
These statements produce
two graphs, each with two vertical axes. The first pair of plot requests
(Y*X and Y2*X) produce one graph in which X is plotted on the horizontal
axis, Y is plotted on the left axis, and Y2 is plotted on the right
axis. The second pair of plot requests (B*A and B2*A) produce another
graph in which A is plotted on the horizontal axis, B is plotted on
the left axis, and B2 is plotted on the right axis.
Using Multiple Plot Requests
Plot
requests of the form (y-variable(s))*(x-variable(s)).
Both the PLOT and PLOT2 statements generate multiple graphs (the actual
plots are produced on separate pages). See Graphs Produced by Multiple Plot Requests in PLOT and PLOT2 Statements.
plot (y b)*(x a);
    plot2 (y2 b2)*(x a);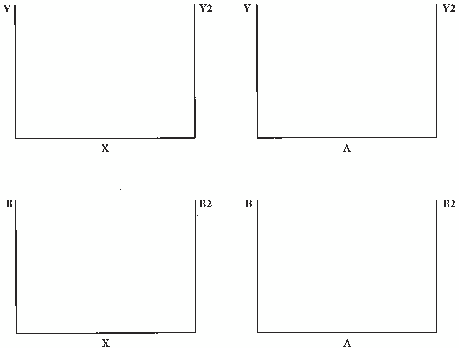
Requesting Plots of Three Variables with a Legend
When both the PLOT and PLOT2 statements
use plot requests of the form y-variable*x-variable=third-variable,
each statement generates a separate legend. If the third variable
has two values, these statements produce one graph with four sets
of data points. See Multiple Plots on One Graph. The figure assumes that SYMBOL statements
are used to specify the plot symbols that are shown and to connect
the data points with straight lines.
plot y*x=z;
    plot2 y2*x=z;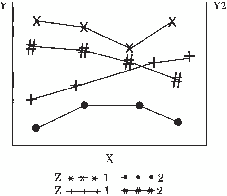
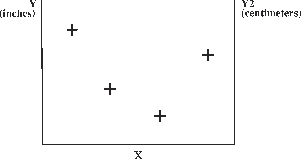
Using a Second Vertical Axis
Displaying the Same Values in a Different Scale
If your data contain the same variable values in two
different scales, such as height in inches and height in centimeters,
you can display one scale of values on the left axis and the other
scale of values on the right axis. If both vertical axes are calibrated
so that they represent the same range of values, then for each observation
of X the data points for Y and Y2 are the same.
For example, if Y is
height in inches and Y2 is height in centimeters and if the Y axis
values range from 0 to 84 inches and the Y2 axis values range from
0 to 213.36 centimeters, the plot is displayed like Right Axis with Different Scale of Values.
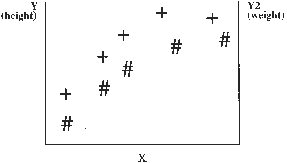
Displaying Different Values
If your data contain
variables with different data values (such as height and weight),
you can display one type of data on the left axis and another type
of data on the right axis. Because the Y variable and the Y2 variable
contain different data, two sets of data points are displayed on the
graph. For
example, if Y is height and Y2 is weight, the plot is like Right Axis with Different Values and Different Scale.
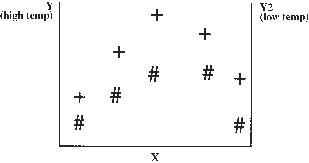
Displaying the Same Scale on Both Axes
If your data contain
two sets of values for the same type of data, you can use the PLOT2
statement to generate a right axis that is calibrated the same as
the left axis so that the data points on the right of the graph are
easier to read.
For example, if Y is high temperatures and Y2 is low temperatures,
you can create a graph like Right Axis with Same Scale of Values.
Using PATTERN and SYMBOL Definitions
The PLOT2
statement uses PATTERN and SYMBOL definitions in the same way the
PLOT statement does. These definitions are assigned in order first
to the PLOT statement and then to the PLOT2 statement.
For more information,
see About SYMBOL Definitions.