GPLOT Procedure
- Syntax

- Overview
- Concepts
- Examples Generating a Simple Bubble PlotLabeling and Sizing Plot BubblesAdding a Right Vertical AxisPlotting Two VariablesConnecting Plot Data PointsGenerating an Overlay PlotFilling Areas in an Overlay PlotPlotting Three VariablesPlotting with Different Scales of ValuesCreating Plots with Drill-down Functionality for the Web
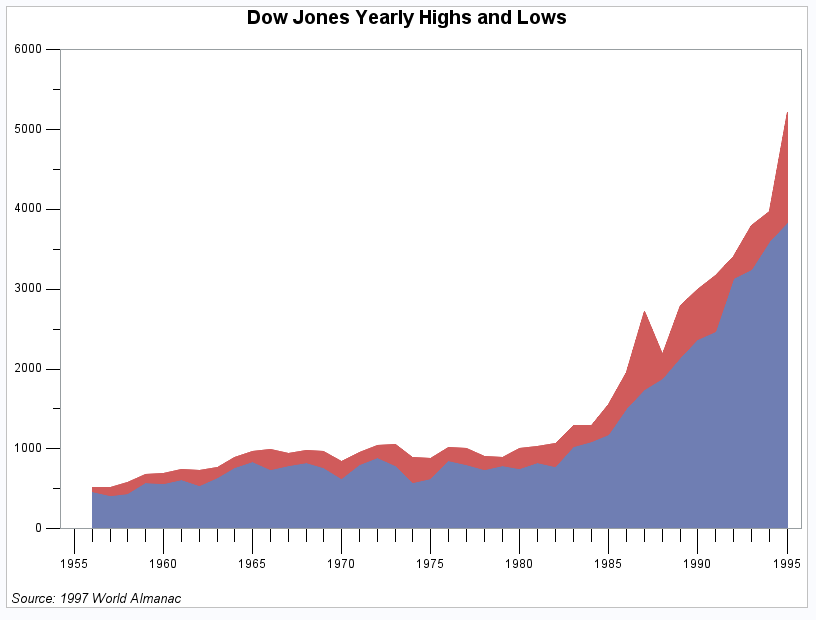
Example 7: Filling Areas in an Overlay Plot
| Features: |
|
| Other features: |
GOPTIONS statement option: BORDER SYMBOL statement |
| Sample library member: | GPLFILL1 |
This example uses the
AREAS= option in the PLOT statement to fill the areas that are under
the plot lines. As in the previous example, two plots are overlaid
on the same graph.
Program
goptions reset=all border;
title1 "Dow Jones Yearly Highs and Lows";
footnote1 j=l " Source: 1997 World Almanac";
data stocks;
   input year high low @@;

   datalines;
1956  521.05  462.35 1957  520.77  419.79
1958  583.65  436.89 1959  679.36  574.46
1960  685.47  568.05 1961  734.91  610.25
1962  726.01  535.76 1963  767.21  646.79
1964  891.71  768.08 1965  969.26  840.59
1966  995.15  744.32 1967  943.08  786.41
1968  985.21  825.13 1969  968.85  769.93
1970  842.00  631.16 1971  950.82  797.97
1972 1036.27  889.15 1973 1051.70  788.31
1974  891.66  577.60 1975  881.81  632.04
1976 1014.79  858.71 1977  999.75  800.85
1978  907.74  742.12 1979  897.61  796.67
1980 1000.17  759.13 1981 1024.05  824.01
1982 1070.55  776.92 1983 1287.20 1027.04
1984 1286.64 1086.57 1985 1553.10 1184.96
1986 1955.57 1502.29 1987 2722.42 1738.74
1988 2183.50 1879.14 1989 2791.41 2144.64
1990 2999.75 2365.10 1991 3168.83 2470.30
1992 3413.21 3136.58 1993 3794.33 3241.95
1994 3978.36 3593.35 1995 5216.47 3832.08
;
symbol1 interpol=join;
axis1 order=(1955 to 1995 by 5) offset=(2,2)
      label=none
      major=(height=2)
      minor=(height=1);
axis2 order=(0 to 6000 by 1000) offset=(0,0)
      label=none
      major=(height=2)
      minor=(height=1);
proc gplot data=stocks;
   plot low*year high*year / overlay
                             haxis=axis1
                             hminor=4
                             vaxis=axis2
                             vminor=1
                             caxis=black
                             areas=2;
run;
quit;
Program Description
Create the data set. STOCKS
contains yearly highs and lows for the Dow Jones Industrial Average
and the dates of the high and low values each year.
data stocks;
   input year high low @@;

   datalines;
1956  521.05  462.35 1957  520.77  419.79
1958  583.65  436.89 1959  679.36  574.46
1960  685.47  568.05 1961  734.91  610.25
1962  726.01  535.76 1963  767.21  646.79
1964  891.71  768.08 1965  969.26  840.59
1966  995.15  744.32 1967  943.08  786.41
1968  985.21  825.13 1969  968.85  769.93
1970  842.00  631.16 1971  950.82  797.97
1972 1036.27  889.15 1973 1051.70  788.31
1974  891.66  577.60 1975  881.81  632.04
1976 1014.79  858.71 1977  999.75  800.85
1978  907.74  742.12 1979  897.61  796.67
1980 1000.17  759.13 1981 1024.05  824.01
1982 1070.55  776.92 1983 1287.20 1027.04
1984 1286.64 1086.57 1985 1553.10 1184.96
1986 1955.57 1502.29 1987 2722.42 1738.74
1988 2183.50 1879.14 1989 2791.41 2144.64
1990 2999.75 2365.10 1991 3168.83 2470.30
1992 3413.21 3136.58 1993 3794.33 3241.95
1994 3978.36 3593.35 1995 5216.47 3832.08
;
Define symbol characteristics. The
INTERPOL= option specifies a line to connect data points. The line
creates the fill boundary.
axis1 order=(1955 to 1995 by 5) offset=(2,2)
      label=none
      major=(height=2)
      minor=(height=1);
axis2 order=(0 to 6000 by 1000) offset=(0,0)
      label=none
      major=(height=2)
      minor=(height=1);
Generate a plot with filled areas. The plot requests are ordered to draw the lowest
plot first. Area 1 occupies the space between the lowest (first) plot
line and the horizontal axis, and area 2 is below the highest (second)
plot line. This arrangement prevents the pattern for area 1 from overlaying
the pattern for area 2. AREAS=2 fills all the areas below the second
plot line.