GPLOT Procedure
- Syntax

- Overview
- Concepts
- Examples Generating a Simple Bubble PlotLabeling and Sizing Plot BubblesAdding a Right Vertical AxisPlotting Two VariablesConnecting Plot Data PointsGenerating an Overlay PlotFilling Areas in an Overlay PlotPlotting Three VariablesPlotting with Different Scales of ValuesCreating Plots with Drill-down Functionality for the Web
Example 4: Plotting Two Variables
| Features: |
|
| Other features: |
GOPTIONS statement option: BORDER SYMBOL statement |
| Sample library member: | GPLVRBL1 |
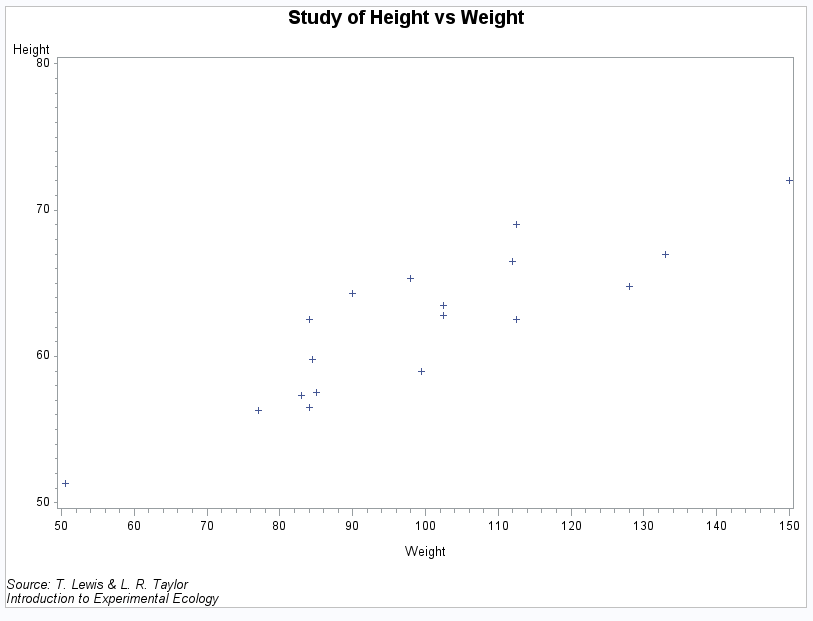
In this example, the
PLOT statement uses a plot request of the type y-variable*x-variable to
plot the variable HEIGHT against the variable WEIGHT. The plot shows
that weight generally increases with size.
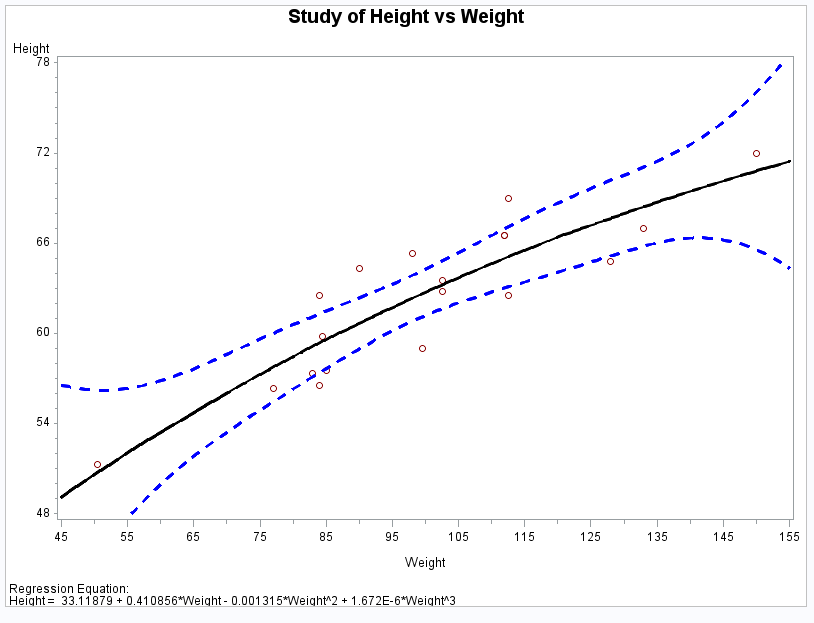
The second example then
requests the same plot with some modifications. As shown by the second
output display, the second plot request specifies a regression analysis
with confidence limits, and scales the range of values along the vertical
and horizontal axes. It also displays the regression equation specified
for the SYMBOL statement. Because the procedure supports RUN-group
processing, you do not have to repeat the PROC GPLOT statement to
generate the second plot.
Program
goptions reset=all border;
title "Study of Height vs Weight";
footnote1 j=l "Source: T. Lewis & L. R. Taylor";
footnote2 j=l "Introduction to Experimental Ecology";
proc gplot data=sashelp.class;
   plot height*weight;
run;
footnote1; /* this clears footnote1 and footnote2 */
symbol1 interpol=rcclm95
       value=circle
       cv=darkred
       ci=black
       co=blue
       width=2;
   plot height*weight / haxis=45 to 155 by 10
                        vaxis=48 to 78 by 6
                        hminor=1
                        regeqn;
run;
quit;
Program Description
title "Study of Height vs Weight";
footnote1 j=l "Source: T. Lewis & L. R. Taylor";
footnote2 j=l "Introduction to Experimental Ecology";
Define symbol characteristics. The
INTERPOL= option specifies a cubic regression analysis with confidence
limits for mean predicted values. The VALUE=and CV= options specify
a plot symbol and color. The CI=, CO=, and WIDTH= options specify
colors and a thickness for the interpolation and confidence-limits
lines.