REPORT Procedure
- Syntax

- Overview
- Concepts
- Using
- Results
- Examples Selecting Variables for a ReportOrdering the Rows in a ReportUsing Aliases to Obtain Multiple Statistics for the Same VariableConsolidating Multiple Observations into One Row of a ReportCreating a Column for Each Value of a VariableDisplaying Multiple Statistics for One VariableStoring and Reusing a Report DefinitionCondensing a Report into Multiple PanelsWriting a Customized Summary on Each PageCalculating PercentagesHow PROC REPORT Handles Missing ValuesCreating and Processing an Output Data SetStoring Computed Variables as Part of a Data SetUsing a Format to Create GroupsSpecifying Style Elements for ODS Output in the PROC REPORT StatementSpecifying Style Elements for ODS Output in Multiple StatementsUsing Multilabel FormatsUsing the WIDTH= and CELLWIDTH= Style Attributes with PROC REPORT
Overview: REPORT Procedure
What Does the REPORT Procedure Do?
The REPORT procedure combines
features of the PRINT, MEANS, and TABULATE procedures with features
of the DATA step in a single report-writing tool that can produce
a variety of reports. You can use PROC REPORT in three ways:
-
in a nonwindowing environment. In this case, you submit a series of statements with the PROC REPORT statement, just as you do in other SAS procedures. You can submit these statements from the Program Editor with the NOWINDOWS option in the PROC REPORT statement, or you can run SAS in batch, noninteractive, or interactive line mode. (See the information about Ways to Run Your SAS Session in SAS Language Reference: Concepts. )
What Types of Reports Can PROC REPORT Produce?
A detail
report contains one row for every observation selected
for the report. Each of these rows is a report row, a detail
report row. A summary report consolidates
data so that each row represents multiple observations. Each of these
rows is also called a detail row, a summary report row.
Both detail and summary reports can contain summary
report lines (break lines) as
well as report rows. A summary line summarizes numerical data for
a set of detail rows or for all detail rows. PROC REPORT provides
both default and customized summaries. (See Using Break Lines.)
This
overview illustrates the types of reports that PROC REPORT can produce.
The statements that create the data sets and formats used in these
reports are in Selecting Variables for a Report. The formats are stored in a permanent SAS library. See
the REPORT procedure examples for more reports and for the statements
that create them.
What Do the Various Types of Reports Look Like?
The
data set that these reports use contains one day's sales figures for
eight stores in a chain of grocery stores.
A simple PROC REPORT
step produces a report similar to one produced by a simple PROC PRINT
step. Simple Detail Report with a Detail Row for Each Observation illustrates the simplest type of report that you can produce
with PROC REPORT. The statements that produce the report follow. The
data set and formats that the program uses are created in Selecting Variables for a Report. Although the WHERE and FORMAT statements are not essential,
here they limit the amount of output and make the values easier to
understand.
options nodate pageno=1 linesize=64 pagesize=60
        fmtsearch=(proclib);

proc report data=grocery nowd;
   where sector='se';
   format sector $sctrfmt. manager $mgrfmt.
          dept $deptfmt. sales dollar10.2;
run;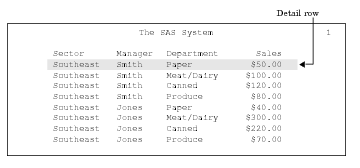
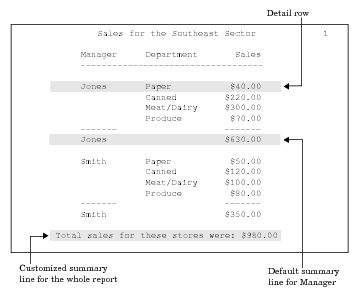
The report in the following
figure uses the same observations as the above figure. However, the
statements that produce this report
For an explanation of
the program that produces this report, see Ordering the Rows in a Report.
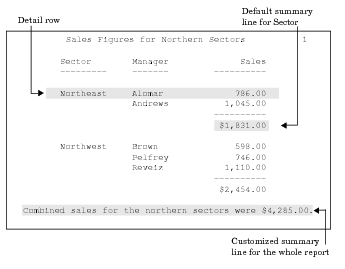
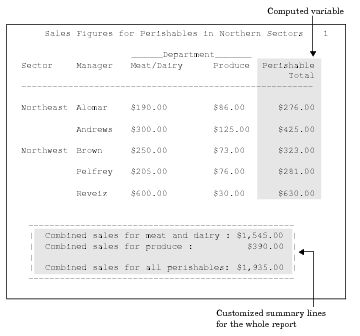
The summary report in
the following figure contains one row for each store in the northern
sector. Each detail row represents four observations in the input
data set, one observation for each department. Information about individual
departments does not appear in this report. Instead, the value of
Sales in each detail row is the sum of the values of Sales in all
four departments. In addition to consolidating multiple observations
into one row of the report, the statements that create this report
For an explanation of
the program that produces this report, see Consolidating Multiple Observations into One Row of a Report.
The summary report in
the following figure is similar to the above figure. The major difference
is that it also includes information for individual departments. Each
selected value of Department forms a column in the report. In addition,
the statements that create this report
For an explanation
of the program that produces this report, see Creating a Column for Each Value of a Variable.
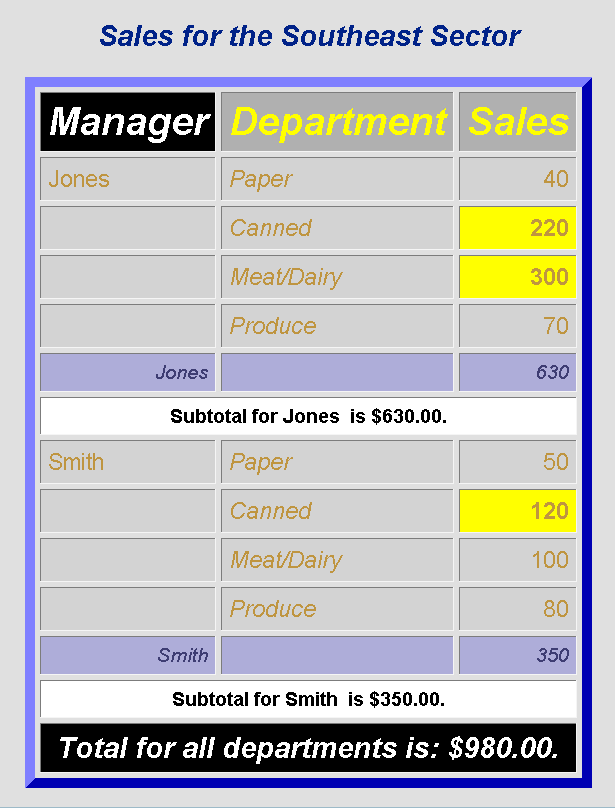
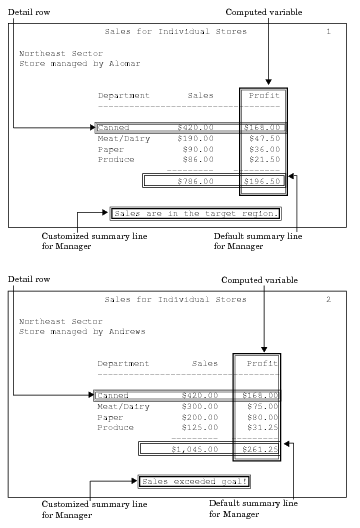
The customized report
in the following figure shows each manager's store on a separate page.
Only the first two pages appear here. The statements that create this
report create
For an explanation of
the program that produces this report, see Writing a Customized Summary on Each Page.
The report in the following
figure uses customized style elements to control things like font
faces, font sizes, and justification, as well as the width of the
border of the table and the width of the spacing between cells. This
report was created by using the HTML destination of the Output Delivery
System (ODS) and the STYLE= option in several statements in the procedure.
For an explanation of
the program that produces this report, see Specifying Style Elements for ODS Output in Multiple Statements. For information about ODS, see Output Delivery System.