REPORT Procedure
- Syntax

- Overview
- Concepts
- Using
- Results
- Examples Selecting Variables for a ReportOrdering the Rows in a ReportUsing Aliases to Obtain Multiple Statistics for the Same VariableConsolidating Multiple Observations into One Row of a ReportCreating a Column for Each Value of a VariableDisplaying Multiple Statistics for One VariableStoring and Reusing a Report DefinitionCondensing a Report into Multiple PanelsWriting a Customized Summary on Each PageCalculating PercentagesHow PROC REPORT Handles Missing ValuesCreating and Processing an Output Data SetStoring Computed Variables as Part of a Data SetUsing a Format to Create GroupsSpecifying Style Elements for ODS Output in the PROC REPORT StatementSpecifying Style Elements for ODS Output in Multiple StatementsUsing Multilabel FormatsUsing the WIDTH= and CELLWIDTH= Style Attributes with PROC REPORT
Concepts: REPORT Procedure
Laying Out a Report
Planning the Layout
Report
writing is simplified if you approach it with a clear understanding
of what you want the report to look like. The most important thing
to determine is the layout of the report. To design the layout, ask
yourself the following types of questions:
When you understand
the layout of the report, use the COLUMN and DEFINE statements in
PROC REPORT to construct the layout.
The COLUMN statement
lists the items that appear in the columns of the report, describes
the arrangement of the columns, and defines headings that span multiple
columns. A report item can be
Omit the COLUMN statement
if you want to include all variables in the input data set in the
same order as they occur in the data set.
Usage of Variables in a Report
Display Variables
A report that contains one or more display variables has a row for
every observation in the input data set. Display variables do not
affect the order of the rows in the report. If no order variables
appear to the left of a display variable, then the order of the rows
in the report reflects the order of the observations in the data set.
By default, PROC REPORT treats all character variables as display
variables. For an example, see Selecting Variables for a Report.
Order Variables
A report that contains one or more order variables has
a row for every observation in the input data set. If no display variable
appears to the left of an order variable, then PROC REPORT orders
the detail rows according to the ascending, formatted values of the
order variable. You can change the default order with ORDER= and DESCENDING
in the DEFINE statement or with the DEFINITION window.
If
the report contains multiple order variables, then PROC REPORT establishes
the order of the detail rows by sorting these variables from left
to right in the report. PROC REPORT does not repeat the value of an
order variable from one row to the next if the value does not change,
unless an order variable to its left changes values. For an example,
see Ordering the Rows in a Report.
Group Variables
If a report contains one or more group variables, then
PROC REPORT tries to consolidate into one row all observations from
the data set that have a unique combination of formatted values for
all group variables.
When PROC REPORT creates
groups, it orders the detail rows by the ascending, formatted values
of the group variable. You can change the default order with ORDER=
and DESCENDING in the DEFINE statement or with the DEFINITION window.
If the report contains
multiple group variables, then the REPORT procedure establishes the
order of the detail rows by sorting these variables from left to right
in the report. PROC REPORT does not repeat the values of a group variable
from one row to the next if the value does not change, unless a group
variable to its left changes values.
If you are familiar
with procedures that use class variables, then you will see that group
variables are class variables that are used in the row dimension in
PROC TABULATE.
Note: You
cannot always create groups. PROC REPORT cannot consolidate observations
into groups if the report contains any order variables or any display
variables that do not have one or more statistics associated with
them. (See the COLUMN statement .) In the interactive report window
environment, if PROC REPORT cannot immediately create groups, then
the procedure changes all display and order variables to group variables
so that it can create the group variable that you requested. In the
nonwindowing environment, it returns to the SAS log a message that
explains why it could not create groups. Instead, it creates a detail
report that displays group variables the same way as it displays order
variables. Even when PROC REPORT creates a detail report, the variables
that you define as group variables retain that usage in their definitions.
Analysis Variables
An analysis variable is a numeric variable that is used
to calculate a statistic for all the observations represented by a
cell of the report. (Across variables, in combination with group variables
or order variables, determine which observations a cell represents.)
You associate a statistic with an analysis variable in the variable's
definition or in the COLUMN statement. By default, PROC REPORT uses
numeric variables as analysis variables that are used to calculate
the Sum statistic.
The value of an analysis
variable depends on where it appears in the report:
For more
information, see the BREAK Statement and RBREAK Statement statements.
-
In a detail report, the value of an analysis variable in a detail row is the value of the statistic associated with that variable calculated for a single observation. Calculating a statistic for a single observation is not practical. However, using the variable as an analysis variable enables you to create summary lines for sets of observations or for all observations.
Across Variables
PROC REPORT creates a column for each value of an across
variable. PROC REPORT orders the columns by the ascending, formatted
values of the across variable. You can change the default order with
ORDER= and DESCENDING in the DEFINE statement or with the DEFINITION
window. If no other variable helps define the column, then PROC REPORT
displays the N statistic (the number of observations in the input
data set that belong to that cell of the report.) See the COLUMN statement .
If
you are familiar with procedures that use class variables, then you
will see that across variables are like class variables that are used
in the column dimension with PROC TABULATE. Generally, you use Across
variables in conjunction with order or group variables. For an example,
see Creating a Column for Each Value of a Variable.
Computed Variables
Computed variables are variables that you define for
the report. They are not in the input data set, and PROC REPORT does
not add them to the input data set. However, computed variables are
included in an output data set if you create one.
In the interactive report
window environment, you add a computed variable to a report from the COMPUTED
VAR window.
In the nonwindowing
environment, you add a computed variable by
For examples, refer to Creating a Column for Each Value of a Variable, Calculating Percentages,
and Storing Computed Variables as Part of a Data Set.
Interactions of Position and Usage
The position and usage of each variable
in the report determine the report's structure and content. PROC REPORT
orders the rows of the report according to the values of order and
group variables, considered from left to right as specified in the
report window or the COLUMN statement. Similarly, PROC REPORT orders
columns for an across variable from left to right, according to the
values of the variable.
Several items can collectively
define the contents of a column in a report. For example, in the following
figure, the values that appear in the third and fourth columns are
collectively determined by Sales, an analysis variable, and by Department,
an across variable. You create this type of report with the COLUMN
statement or, in the interactive report window environment, by placing
report items above or below each other. This arrangement is called
stacking items in the report because each item generates a heading,
and the headings are stacked one above the other.
title 'The SAS System'       ;
options nodate pageno=1 linesize=64 pagesize=60 fmtsearch=(proclib);
proc report data=grocery nowd headskip headline split='*';
   column sector manager department,sales perish;
   define sector / group format=$sctrfmt. 'Sector' '';
   define manager / group format=$mgrfmt. 'Manager* ';
   define department/ across format=$deptfmt. '_Department_';
   define sales / analysis sum format=dollar11.2 ' ';
   define perish / computed format=dollar11.2 'Perishable Total';
   break after manager / skip;
   compute perish;
      perish=_c3_+_c4_;
   endcomp;
   title "Sales Figures for Perishables in Northern Sectors";
   where sector contains 'n' and (department='p1' or department='p2');
run;
title; 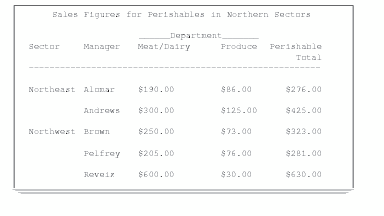
When you use multiple
items to define the contents of a column, at most one of the following
can be in a column:
More than one of these
items in a column creates a conflict for PROC REPORT about which values
to display.
When a column is defined
by stacked report items, PROC REPORT formats the values in the column
by using the format that is specified for the lowest report item in
the stack that does not have an ACROSS usage.
Statistics That Are Available in PROC REPORT
These statistics, the
formulas that are used to calculate them, and their data requirements
are discussed in Keywords and Formulas.
To compute standard
error and the Student's t-test, you must use
the default value of VARDEF=, which is DF.
Every statistic except
N must be associated with a variable. You associate a statistic with
a variable either by placing the statistic above or below a numeric
display variable or by specifying the statistic as a usage option
in the DEFINE statement or in the DEFINITION window
for an analysis variable.
Using Compute Blocks
What Is a Compute Block?
A compute
block is one or more programming statements that appear
either between a COMPUTE and an ENDCOMP statement or in a COMPUTE window.
PROC REPORT executes these statements as it builds the report. A compute
block can be associated with a report item (a data set variable, a
statistic, or a computed variable) or with a location (at the top
or bottom of the report; before or after a set of observations). You
create a compute block with the COMPUTE window
or with the COMPUTE statement. One form of the COMPUTE statement associates
the compute block with a report item. Another form associates the
compute block with a location in the report. (See Using Break Lines.)
Note: When you use the COMPUTE
statement, you do not have to use a corresponding BREAK or RBREAK
statement. (See Ordering the Rows in a Report, which uses COMPUTE AFTER but does not use the RBREAK statement).
Use these statements only when you want to implement one or more BREAK
statement or RBREAK statement options. (See Writing a Customized Summary on Each Page, which uses both COMPUTE AFTER MANAGER and BREAK AFTER MANAGER.)
The Purpose of Compute Blocks
A compute block that
is associated with a report item can
-
define display attributes for a report item. (See CALL DEFINE Statement.)
In addition, all compute
blocks can use most SAS language elements to perform calculations.
(See The Contents of Compute Blocks.) A PROC REPORT step can contain multiple compute blocks,
but they cannot be nested.
The Contents of Compute Blocks
In
the interactive report window environment, a compute block is in a COMPUTE window.
In the nonwindowing environment, a compute block begins with a COMPUTE
statement and ends with an ENDCOMP statement. Within a compute block,
you can use these SAS language elements:
Within a compute block,
you can also use these PROC REPORT features:
-
Compute blocks for a customized summary can contain one or more LINE statements, which place customized text and formatted values in the summary. (See the LINE Statement.)
-
Compute blocks for a report item can contain one or more CALL DEFINE statements, which set attributes like color and format each time a value for the item is placed in the report. (See the CALL DEFINE Statement.)
-
Any compute block can reference the automatic variable _BREAK_. (See The Automatic Variable _BREAK_.)
Four Ways to Reference Report Items in a Compute Block
A compute block can reference any report item that forms
a column in the report (whether the column is visible). You reference
report items in a compute block in one of four ways:
Note: Referencing variables that have missing values leads
to missing values. If a compute block references a variable that has
a missing value, then PROC REPORT displays that variable as a blank
(for character variables) or as a period (for numeric variables).
Refer
to Using Aliases to Obtain Multiple Statistics for the Same Variable, which
references analysis variables by their aliases; Creating a Column for Each Value of a Variable, which references variables
by column number; and Calculating Percentages, which references group variables
and computed variables by name.
Compute Block Processing
PROC
REPORT processes compute blocks in two different ways.
-
If a compute block is associated with a location, then PROC REPORT executes the compute block only at that location. Because PROC REPORT calculates statistics for groups before it actually constructs the rows of the report, statistics for sets of report rows are available before or after the rows are displayed, as are values for any variables based on these statistics.
-
If a compute block is associated with a report item, then PROC REPORT executes the compute block on every row of the report when it comes to the column for that item. The value of a computed variable in any row of a report is the last value assigned to that variable during that execution of the DATA step statements in the compute block. PROC REPORT assigns values to the columns in a row of a report from left to right. Consequently, you cannot base the calculation of a computed variable on any variable that appears to its right in the report.
Note: PROC REPORT recalculates
computed variables at breaks. For details about compute block processing
see How PROC REPORT Builds a Report .
Using Break Lines
What Are Break Lines?
Creating Break Lines
There
are two ways to create break lines. The first way is simpler. It
produces a default summary. The second way is more flexible. It produces
a customized summary and provides a way to slightly modify a default
summary. Default summaries and customized summaries can appear at
the same location in a report.
Default summaries are
produced with the BREAK statement, the RBREAK statement, or the BREAK window.
You can use default summaries to visually separate parts of the report,
to summarize information for numeric variables, or both. Options
provide some control over the appearance of the break lines, but if
you choose to summarize numeric variables, then you have no control
over the content and the placement of the summary information. (A
break line that summarizes information is a summary line.)
Order of Break Lines
You control
the order of the lines in a customized summary. However, PROC REPORT
controls the order of lines in a default summary and the placement
of a customized summary relative to a default summary. When a default
summary contains multiple break lines, the order in which the break
lines appear is
Using Compound Names
When you use a statistic in a report, you generally refer to it in
compute blocks by a compound name like Sales.sum. However, in different
parts of the report, that same name has different meanings. Consider
the report in the following output. The statements that create the
output follow. The user-defined formats that are used are created
by a PROC
FORMAT step.
options nodate pageno=1 linesize=64
        pagesize=60 fmtsearch=(proclib);
proc report data=grocery nowindows;
   column sector manager sales;
   define sector / group format=$sctrfmt.;
   define sales  / analysis sum
                   format=dollar9.2;
   define manager / group format=$mgrfmt.;
   break after sector / summarize skip ol;
   rbreak after / summarize dol dul;
   compute after;
      sector='Total:';
   endcomp;
run;
Three Different Meanings of Sales.sum
                         The SAS System
1

                 Sector     Manager      Sales
                 Northeast  Alomar     $786.00     1
                            Andrews  $1,045.00
                 ---------           ---------
                 Northeast           $1,831.00     2

                 Northwest  Brown      $598.00
                            Pelfrey    $746.00
                            Reveiz   $1,110.00
                 ---------           ---------
                 Northwest           $2,454.00

                 Southeast  Jones      $630.00
                            Smith      $350.00
                 ---------           ---------
                 Southeast             $980.00

                 Southwest  Adams      $695.00
                            Taylor     $353.00
                 ---------           ---------
                 Southwest           $1,048.00

                 =========           =========
                 Total:              $6,313.00     3
                 =========           =========
Here Sales.sum has three different meanings:
| 1 | In detail rows, the value is the sales for one manager's store in a sector of the city. For example, the first detail row of the report shows that the sales for the store that Alomar manages were $786.00. |
| 2 | In the group summary lines, the value is the sales for all the stores in one sector. For example, the first group summary line shows that sales for the Northeast sector were $1,831.00. |
| 3 | In the report summary line, the value $6,313.00 is the sales for all stores in the city. |
Note: When you refer in a compute
block to a statistic that has an alias, do not use a compound name.
Generally, you must use the alias. However, if the statistic shares
a column with an across variable, then you must reference it by column
number. (See Four Ways to Reference Report Items in a Compute Block.)
Using Style Elements in PROC REPORT
Using the STYLE= Option
If
you use the Output Delivery System to create HTML, RTF, or Printer
output from PROC REPORT, then you can use the STYLE= option to specify
style elements for the procedure to use in various parts of the report.
Style elements determine presentation attributes like font type, font
weight, color, and so on. For information about style attributes and their values,
see Style Attributes Tables in SAS Output Delivery System: User's Guide.
STYLE<(location(s))>=<style-element-name><[style-attribute-specification(s)]>
is
the name of a style element that is part of a style definition that
is registered with the Output Delivery System. SAS provides some style
definitions. Refer to ODS Style Elements in SAS Output Delivery System: User's Guide for a list of
SAS provided style elements. Users can create their own style definitions
with the TEMPLATE procedure. See the TEMPLATE Procedure: Overview in SAS Output Delivery System: User's Guide. The following table shows the default
style elements for each statement.
describes the style
attribute to change. Each style-attribute-specification has
this general form:
To specify more than one style-attribute-specification,
separate each one with a space.
style-attribute-name=style-attribute-value
The following table
shows valid values of style-attribute-name
for PROC REPORT. Note that not all style attributes are valid in all
destinations. See Style Attributes Tables in SAS Output Delivery System: User's Guide for more information
about style attributes, their valid values, and
their applicable destinations.
Specifications in a
PROC REPORT statement other than the PROC REPORT location override
the same specification in the PROC REPORT statement. However, any
style attributes that you specify in the PROC REPORT statement and
do not override in another PROC REPORT statement are inherited. For
example, if you specify a blue background and a white foreground for
all column headings in the PROC REPORT statement, and you specify
a gray background for the column headings of a variable in the PROC
REPORT DEFINE statement, then the background for that particular column
heading is gray, and the foreground is white (as specified in the
PROC REPORT statement).
Using a Format to Assign a Style Attribute Value
You
can use a format to assign a style attribute value. For example, the
following code assigns a red background color to cells in the Profit
column for which the value is negative, and a green background color
where the values are positive:
proc format;
   value proffmt low-<0='red'
                 0-high='green';
run;
ods html body='external-HTML-file';
proc report data=profits nowd;
   title 'Profits for Individual Stores';
   column Store Profit;
   define Store / display 'Store';
   define Profit / display 'Profit' style=[backgroundcolor=proffmt.];
run;
ods html close;
Controlling the Spacing between Rows
Users frequently need to “shrink”
a report to fit more rows on a page. Shrinking a report involves changing
both the font size and the spacing between the rows. In order to give
maximum flexibility to the user, ODS uses the font size that is specified
for the REPORT location to calculate the spacing between the rows.
Therefore, to shrink a table, change the font size for both the REPORT
location and the COLUMN location. Here is an example:
Printing a Report
Printing with ODS
Printing reports with the Output
Delivery System is much simpler and provides more attractive output
than the older methods of printing that are documented here. For best
results, use an output destination in the ODS printer family or RTF.
For details about these destinations and on using the ODS statements,
see SAS Output Delivery System: User's Guide.
Printing from the REPORT Window
By default, if you print from the REPORT window,
then the report is routed directly to your printer. If you want, you
can specify a form to use for printing. (See Printing with a Form.) Forms specify things like the type of printer that you
are using, text format, and page orientation.
Operating Environment Information: Printing
is implemented differently in different operating environments. See Printing with SAS in SAS Language Reference: Concepts for information
related to printing. Additional information might
be available in the SAS documentation for your operating environment.
Printing from Noninteractive or Batch Mode
If you use
noninteractive or batch mode, then SAS writes the output either to
the display or to external files, depending on the operating environment
and on the SAS options that you use. Refer to the SAS documentation
for your operating environment for information about how these files
are named and where they are stored.
Using PROC PRINTTO
PROC PRINTTO defines destinations for the SAS output
and the SAS log. (See PRINTTO Procedure.)
PROC PRINTTO does not
use a form, but it does write carriage-control characters if you are
writing to a print file.
Note: You need two PROC PRINTTO
steps. The first PROC PRINTTO step precedes the PROC REPORT step.
It redirects the output to a file. The second PROC PRINTTO step follows
the PROC REPORT step. It reestablishes the default destination and
frees the output file. You cannot print the file until PROC PRINTTO
frees it.
Storing and Reusing a Report Definition
The OUTREPT= option in the PROC
REPORT statement stores a report definition in the specified catalog
entry. If you are working in the nonwindowing environment, then the
definition is based on the PROC REPORT step that you submit. If you
are in the interactive report window environment, then the definition
is based on the report that is in the REPORT window
when you end the procedure. SAS assigns an entry type of REPT to
the entry.
In the interactive report
window environment, you can save the definition of the current report
by selecting File Save
Report.
A report definition might differ from the SAS program that creates
the report. See the discussion of OUTREPT= .
Save
Report.
A report definition might differ from the SAS program that creates
the report. See the discussion of OUTREPT= .
You can use a report
definition to create an identically structured report for any SAS
data set that contains variables with the same names as the ones that
are used in the report definition. Use the REPORT= option in the PROC
REPORT statement to load a report definition when you start PROC REPORT.
In the interactive report window environment, load a report definition
from the LOAD REPORT window by selecting
FileOpen Report.
ODS Destinations Supported by PROC REPORT
Prior
to SAS 9.2, the ODS DOCUMENT and the ODS OUTPUT destinations were
unsupported by PROC REPORT. Now, PROC REPORT supports all ODS destinations.
Refer to Understanding ODS Destinations in SAS Output Delivery System: User's Guide for detailed information.
The
DOCUMENT destination enables you to restructure, navigate, and replay
your data in different ways and to different destinations without
rerunning your analysis or repeating your database query. The DOCUMENT
destination makes your entire output stream available in "raw" form
and accessible to you to customize. The output is kept in the original
internal representation as a data component plus a table definition.
When the output is in a DOCUMENT form, it is possible to rearrange,
restructure, and reformat without rerunning your analysis. Refer to The DOCUMENT Procedure in SAS Output Delivery System: User's Guide for additional
information.
The
OUTPUT destination produces SAS output data sets. Because ODS already
knows the logical structure of the data and its native form, ODS can
output a SAS data set that represents exactly the same resulting data
set that the procedure worked with internally. Refer to the ODS OUTPUT Statement in SAS Output Delivery System: User's Guide for additional
information.