GRADAR Procedure

Example 6: Modifying Chart Axes
| Features: |
FORMAT procedure |
| Sample library member: | GRRAXIS |
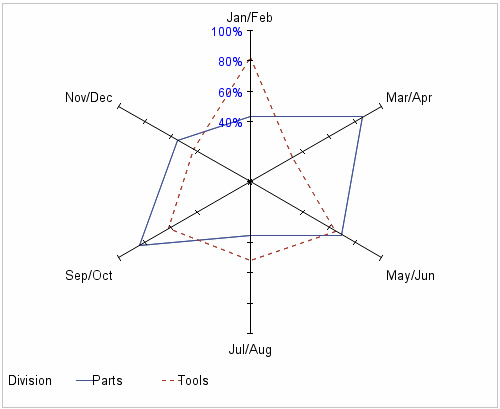
You can use AXIS statements to modify the tick marks
that appear on the chart spokes and the order in which the tick mark
labels appear. This example uses AXIS statements, in addition to formats,
to modify the tick marks, tick mark labels, and axis labels on the
radar chart spokes.
Program
libname library "library-specification";
proc format library=library;
value mnth
   1="Jan/Feb" 2="Mar/Apr" 3="May/Jun"
   4="Jul/Aug" 5="Sep/Oct" 6="Nov/Dec";
run;
data goals;
   input month Division $ value @@;
   format month mnth.;
   format value percentn7.0;
datalines;
1 Parts .43 1 Tools .82
2 Parts .86 2 Tools .32
3 Parts .70 3 Tools .65
4 Parts .35 4 Tools .52
5 Parts .84 5 Tools .62
6 Parts .55 6 Tools .43
;
run;
goptions reset=all border hsize=5.15in vsize=4.2in;
axis1 order=(0 to .4 by .4, .6 to 1 by .2) value=(height=3pct c=blue tick=1 "");
axis2 order=(0 to .4 by .4, .6 to 1 by .2) value=none;
proc gradar data=goals;
   chart month / sumvar=value
      staraxis=(axis1 axis2 axis2 axis2 axis2 axis2)
      noframe height=3.25
      starinradius=0
      overlayvar=division;
run;
quit;
Program Description
Create a user-defined format, MNTH, for the axis labels. Replace library-specification with the path to your library.
libname library "library-specification";
proc format library=library;
value mnth
   1="Jan/Feb" 2="Mar/Apr" 3="May/Jun"
   4="Jul/Aug" 5="Sep/Oct" 6="Nov/Dec";
run;
Create the input data set WORK.GOALS. The user-defined format is applied to the variable
MONTH, and the SAS format PERCENTN7.0 is applied to the variable VALUE.
data goals;
   input month Division $ value @@;
   format month mnth.;
   format value percentn7.0;
datalines;
1 Parts .43 1 Tools .82
2 Parts .86 2 Tools .32
3 Parts .70 3 Tools .65
4 Parts .35 4 Tools .52
5 Parts .84 5 Tools .62
6 Parts .55 6 Tools .43
;
run;
Define tick marks for the chart spokes.The AXIS1 statement controls the tick marks for the
first (12 o’clock) axis. The ORDER= option specifies the tick
mark interval and the actual values that correspond to each the tick
mark. The format PERCENTn7.0 that was applied to the variable VALUE
in the DATA step controls how the values are displayed for the tick
mark labels. The VALUE= option specifies the size and color of the
tick mark labels. The AXIS2 statement controls all axes except the
first. For those axes, the VALUE= option specifies that no tick mark
labels are displayed.
axis1 order=(0 to .4 by .4, .6 to 1 by .2) value=(height=3pct c=blue tick=1 "");
axis2 order=(0 to .4 by .4, .6 to 1 by .2) value=none;