GRADAR Procedure

Example 5: Modifying the Appearance of Radar Charts
| Features: |
|
| Sample library member: | GRRAPEAR |
For overlay charts with multiple
stars, the lines for the stars are rotated through different line
styles and colors so that the different stars can be easily seen.
Rather than relying on the default rotation patterns, you can control
the line colors, widths, and styles with the CSTARS=, LSTARS=, and
WSTARS= options.
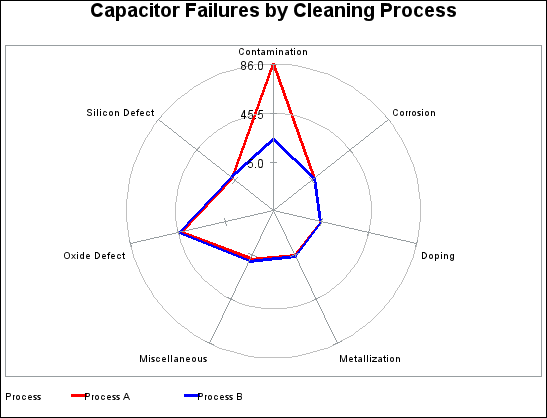
The CSTARS= option
specifies a different color for each of the star outlines in the chart.
The WSTARS= option specifies the width of the line for each star
outline. The LSTARS= option specifies a solid line as the line style
for each star outline. The STARCIRCLES= option determines that two
reference circles are superimposed on the star charts. The value 1.0
determines that a circle with a radius equal to the spoke length is
displayed. The value 0.5 determines that a circle is displayed half
way between the outer circle and the smallest circle (value 0.0) that
could be drawn for the chart. The value 0.0 would display a circle
at the minimum data value, which does not mean that it is actually
0. For example, for data values of 4, 8, 10, and 12, STARCIRCLES=(0.0
1.0) would draw circles at 4 and 12.