GRADAR Procedure

Example 4: Using Multiple Classification Variables in Radar Charts
| Features: |
|
| Sample library member: | GRRTWOWY |
You can study
the effects of two classifications simultaneously with a two-way comparative
radar chart. This arrangement provides the opportunity to discover
both one-way marginal effects and interaction effects. To produce
the chart, use both the ACROSSVAR= and DOWNVAR= options.
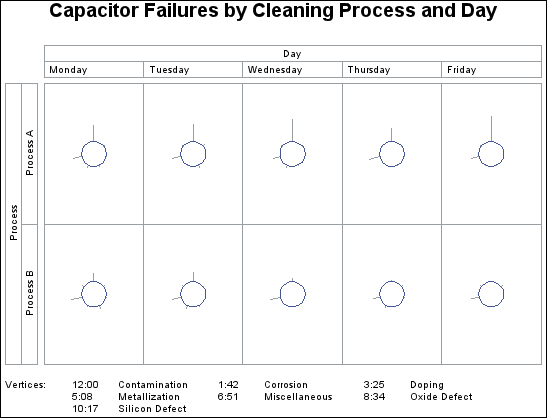
The ACROSSVAR= option
specifies variable DAY as the variable whose values determine the
rows in the chart matrix. The DOWNVAR= option specifies variable PROCESS
as the variable whose values determine the columns in the chart matrix.
The STARTYPE= option determines that the stars are displayed with
rays emanating from the inner circle. The NROWS= and NCOLS= options
specify the number of rows and columns in the chart. The STARLEGEND=CLOCK
option generates a legend that identifies spoke positions. Value CLOCK
determines that the positions are identified using a clock metaphor.