GRADAR Procedure

Example 8: Creating a Calendar Chart
| Features: |
|
| Sample library member: | GRRCALEN |
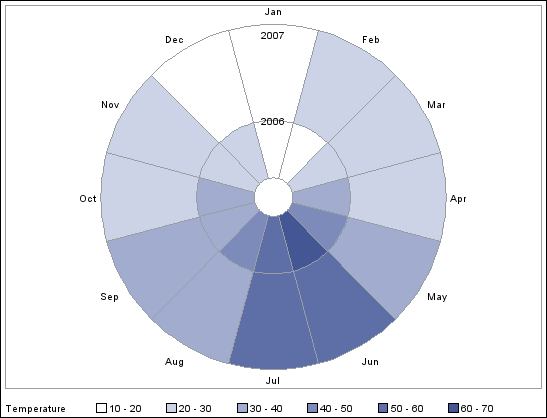
The CALENDAR option produces a chart with 12 equal-sized
segments, one for each month of the year. The color shading of each
segment represents the magnitude of the frequency variable. Use the
OVERLAY variable to subdivide each segment (for example, by year).
goptions reset=all border;

data climate;
   input Year Month $ Temperature @@;
datalines;
2006 Jan 16 2006 Feb 19 2006 Mar 22 2006 Apr 33
2006 May 41 2006 Jun 60 2006 Jul 55 2006 Aug 41
2006 Sep 38 2006 Oct 30 2006 Nov 27 2006 Dec 20
2007 Jan 18 2007 Feb 23 2007 Mar 20 2007 Apr 27
2007 May 33 2007 Jun 52 2007 Jul 55 2007 Aug 38
2007 Sep 38 2007 Oct 27 2007 Nov 26 2007 Dec 19
run;

proc gradar data=climate;
    chart month / freq=temperature
    calendar
    overlayvar=year;
    run;
quit;