Click on the About tab within each sample for product and release requirements.
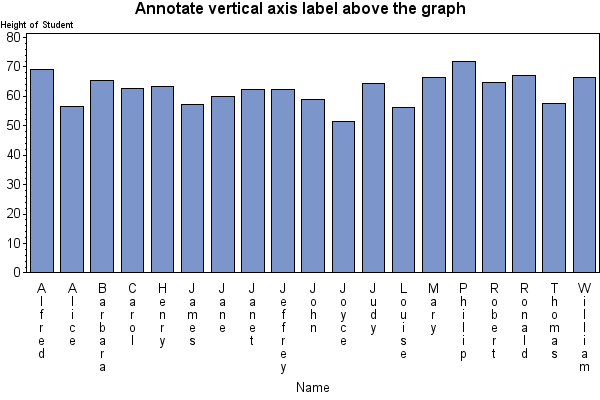
Sample 66393 - Use the Annotate facility to create a vertical axis label above a graph[ View Code ]
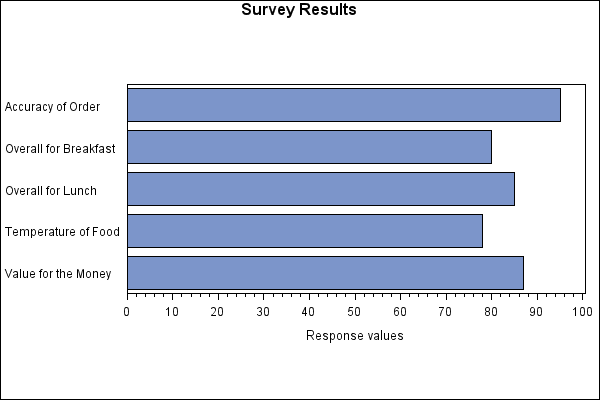
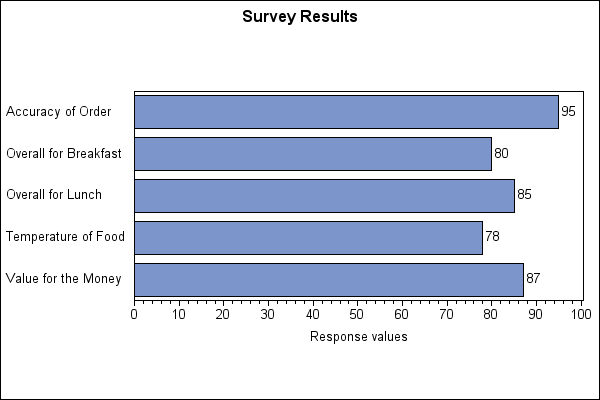
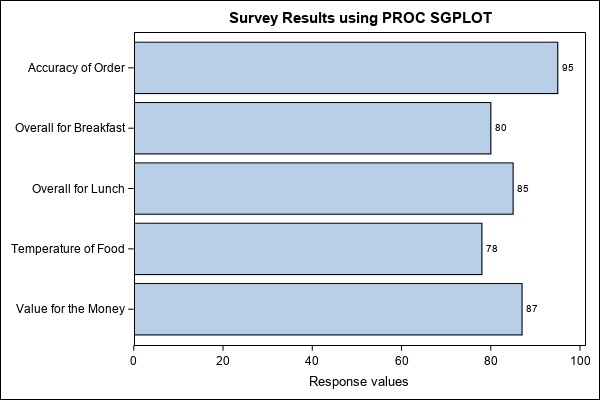
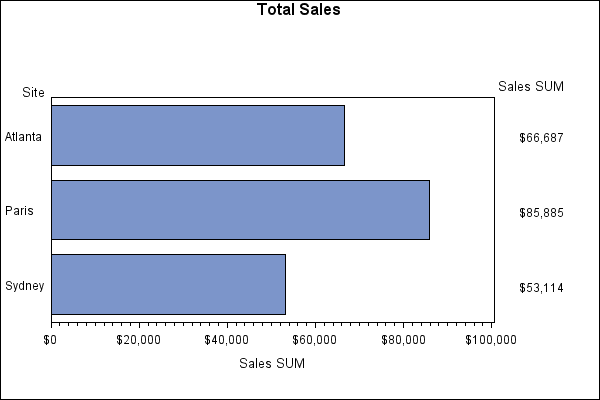
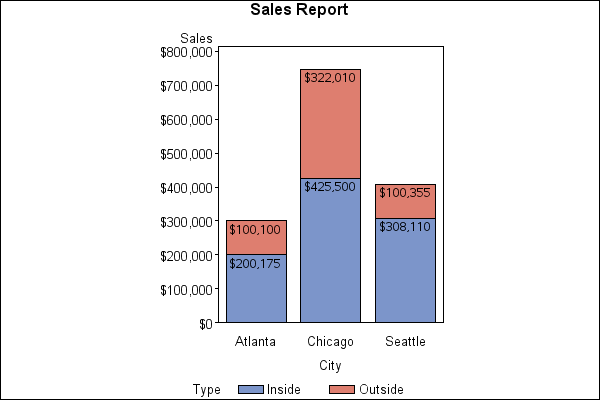
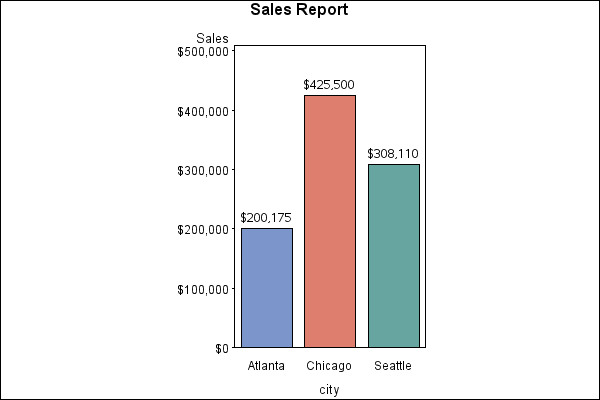
Sample 52468 - Place values at the end of each bar on a horizontal bar chart[ View Code ]
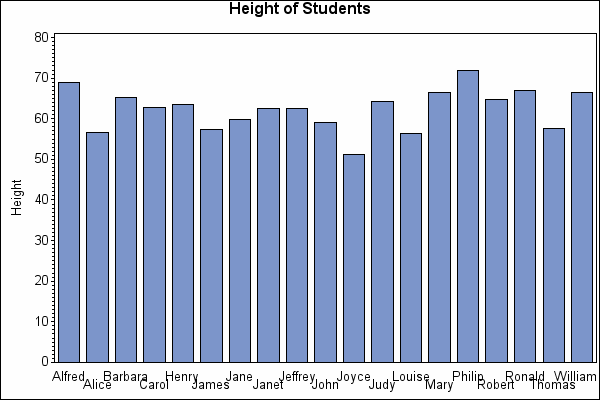
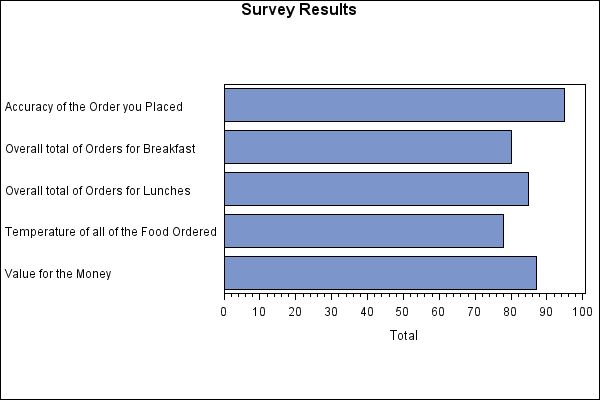
Sample 51732 - Stagger axis values with PROC GCHART[ View Code ]
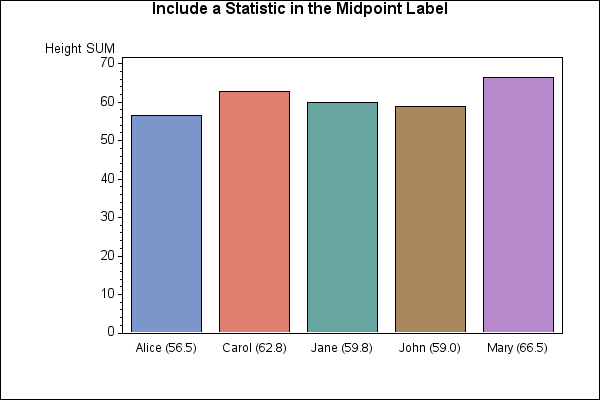
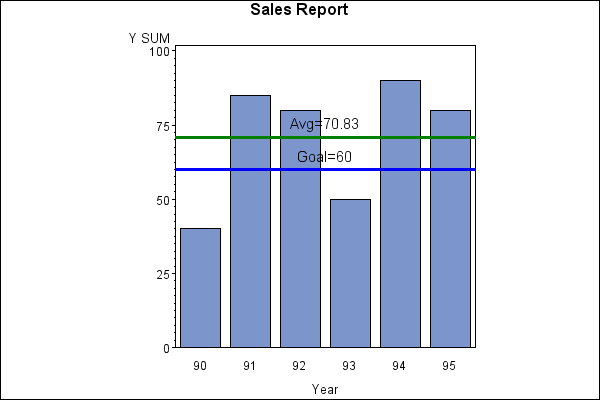
Sample 50545 - Include a statistic value in the midpoint axis label with PROC GCHART[ View Code ]
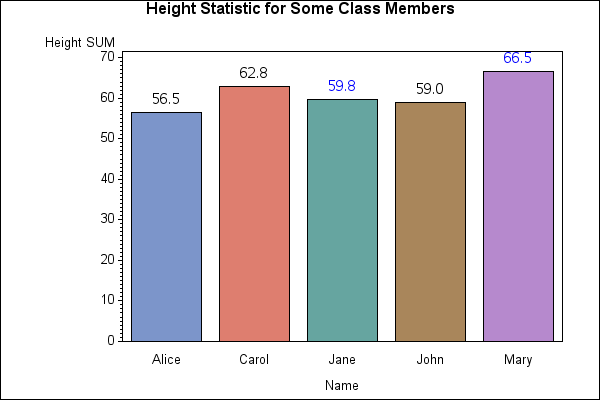
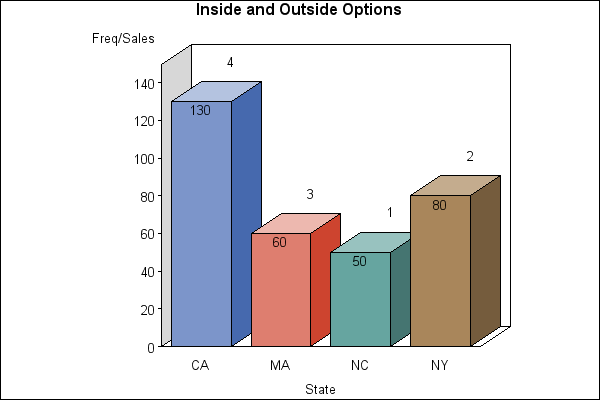
Sample 50541 - Change the color of specific statistics above the bars with PROC GCHART[ View Code ]
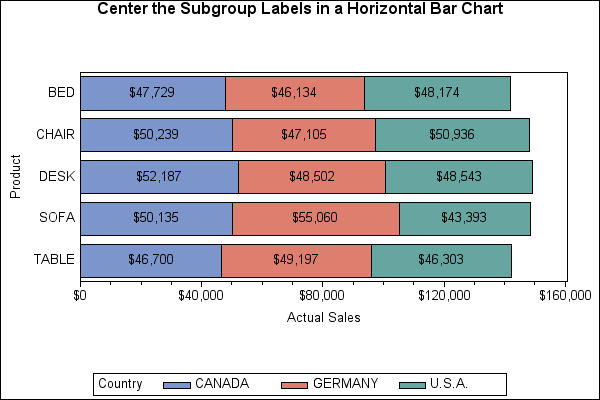
Sample 48451 - Center the subgroup labels in a horizontal bar chart created with PROC GCHART[ View Code ]
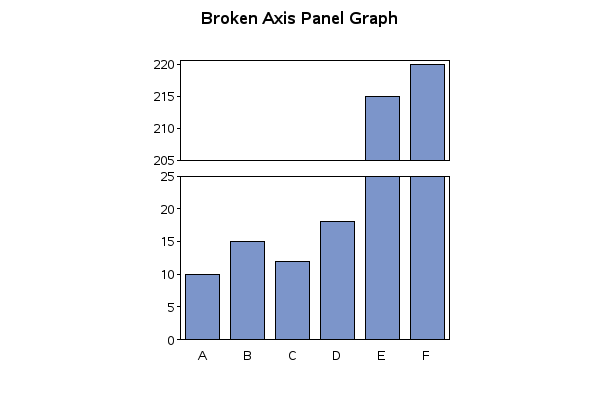
Sample 48333 - Create a broken axis panel graph using the GCHART and GREPLAY procedures[ View Code ]
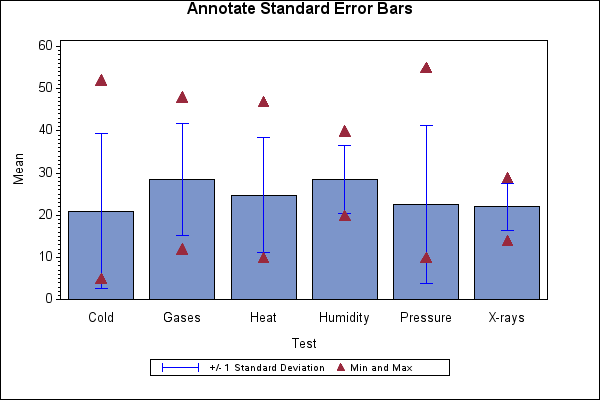
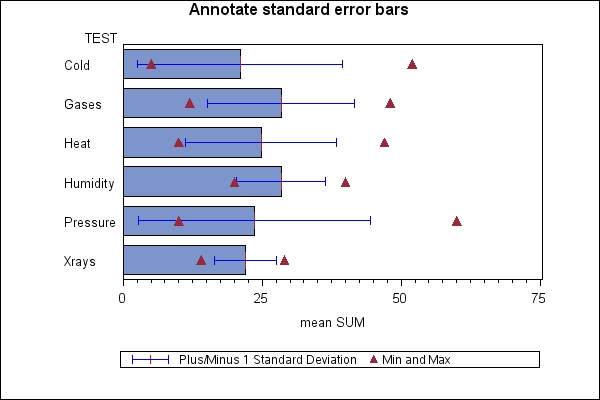
Sample 47076 - Annotate standard errors bars with PROC GCHART[ View Code ]
Sample 46439 - Annotate a text label outside of small bars with PROC GCHART[ View Code ]
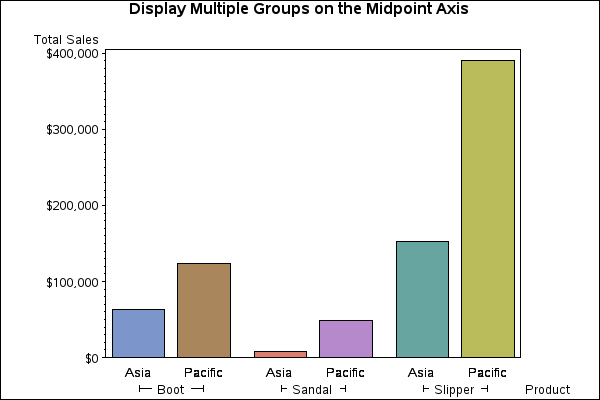
Sample 45124 - Display multiple groups on the midpoint axis with PROC GCHART[ View Code ]
Sample 45123 - Split format label for midpoint axis values with PROC GCHART[ View Code ]
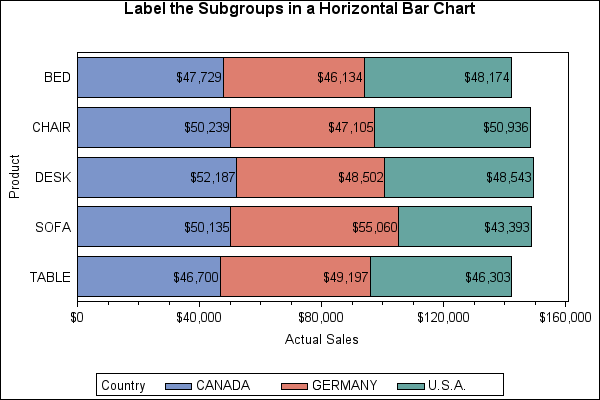
Sample 45056 - Label the subgroups in a horizontal bar chart using PROC GCHART[ View Code ]
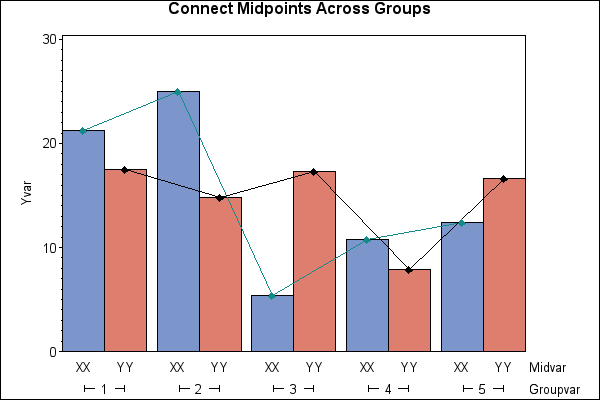
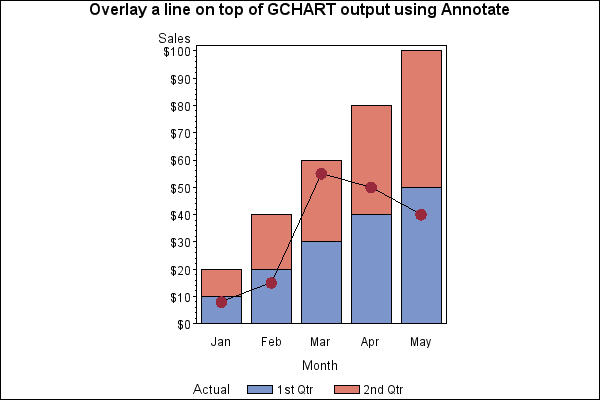
Sample 43865 - Connect midpoints across groups with PROC GCHART[ View Code ]
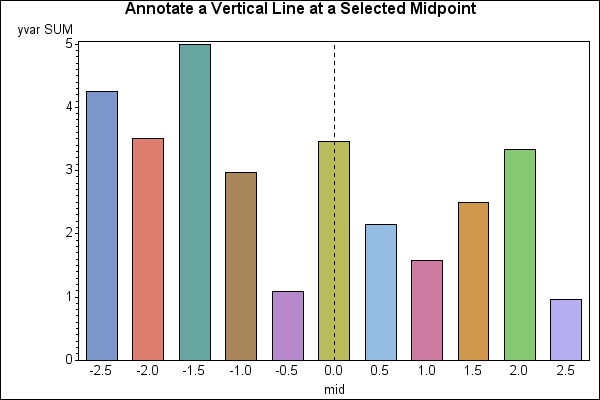
Sample 43864 - Draw a vertical line at a selected midpoint with PROC GCHART[ View Code ]
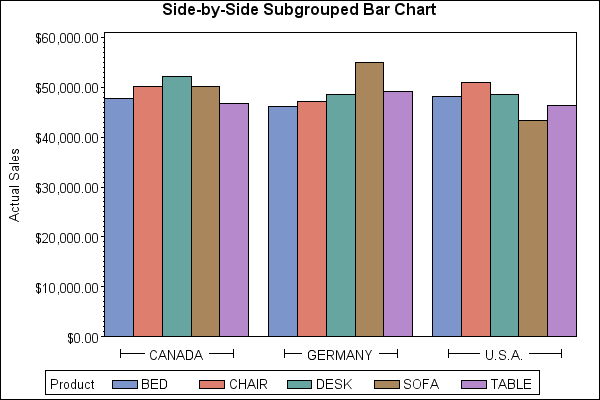
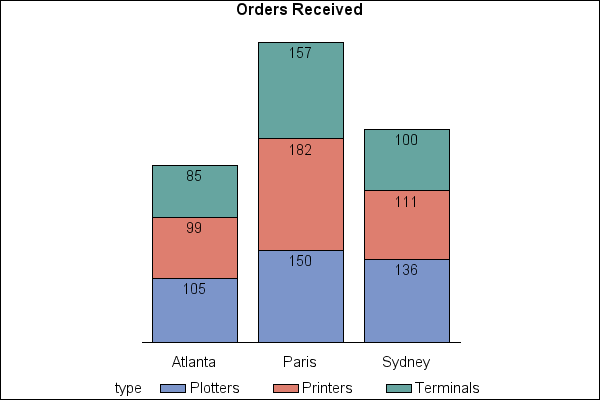
Sample 42871 - Produce a side-by-side subgrouped vertical bar chart[ View Code ]
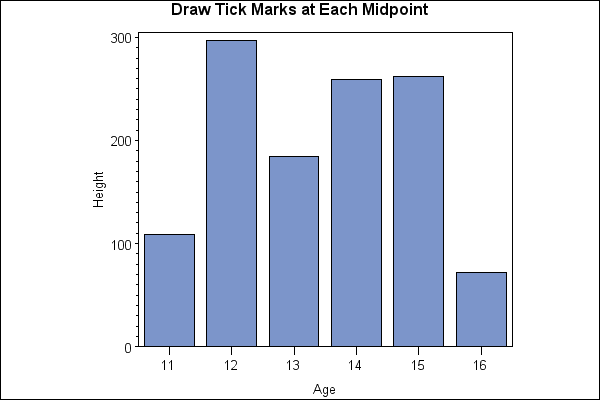
Sample 42513 - Draw tick marks at each midpoint on a vertical bar chart[ View Code ]
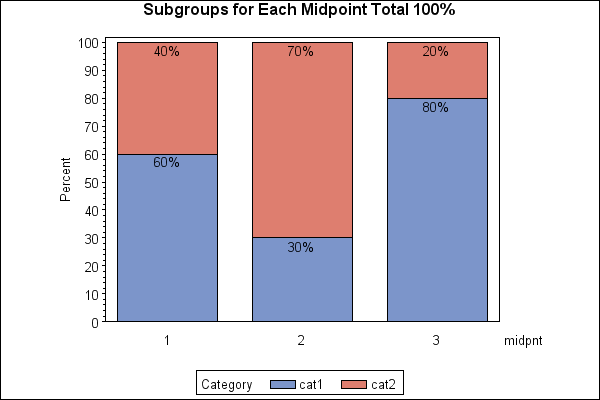
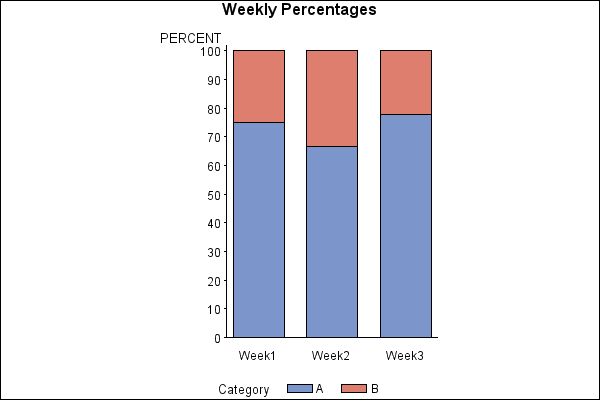
Sample 41976 - Create a bar chart in which the subgroups total 100% for each midpoint[ View Code ]
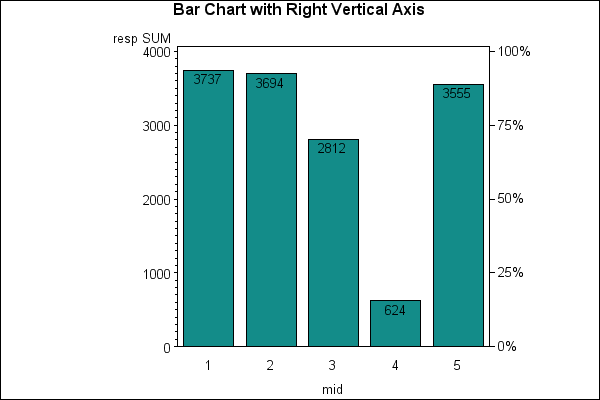
Sample 41975 - Annotate a right vertical axis on PROC GCHART output[ View Code ]
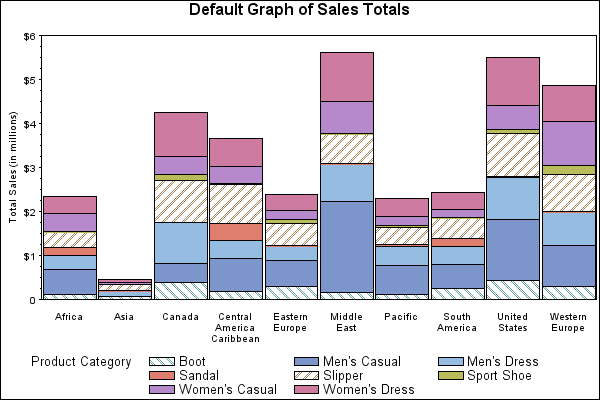
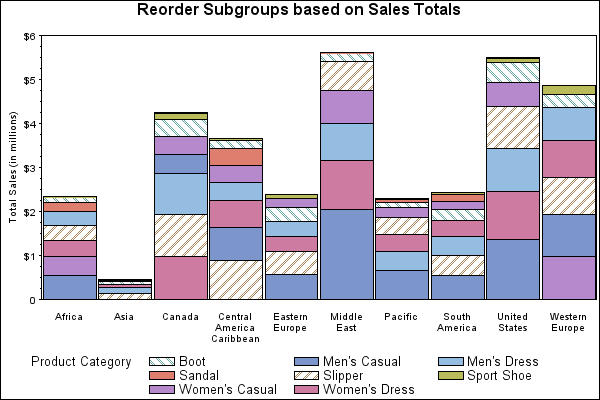
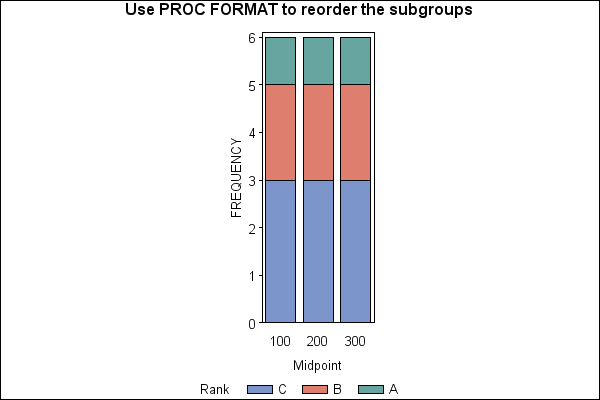
Sample 41603 - Reorder the subgroups in stacked bars using PROC GCHART[ View Code ]
Sample 40177 - Use the COUTLINE= option with PROC GCHART and the VBAR3D statement[ View Code ]
Sample 40176 - Use the PLABEL= option with PROC GCHART to control the text attributes of pie slice labels[ View Code ]
Sample 36844 - Specify the radius of a pie chart using the RADIUS= option with PROC GCHART[ View Code ]
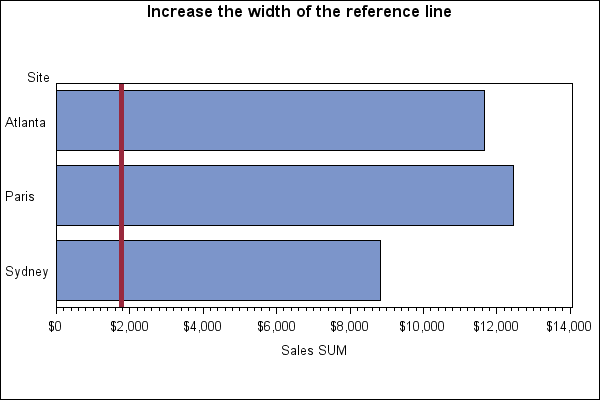
Sample 36841 - Increase the width of a reference line in PROC GCHART using the WREF= option[ View Code ]
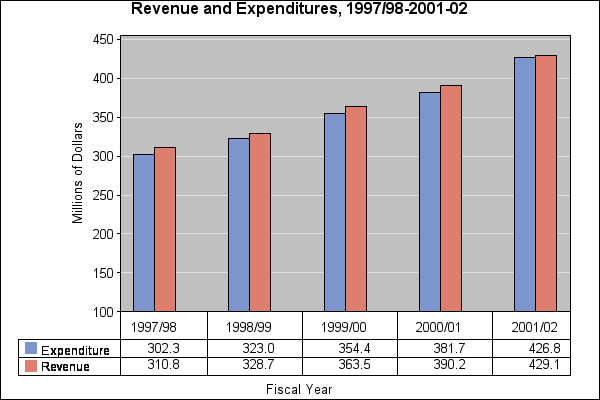
Sample 35774 - Display a connected data table beneath a bar chart[ View Code ]
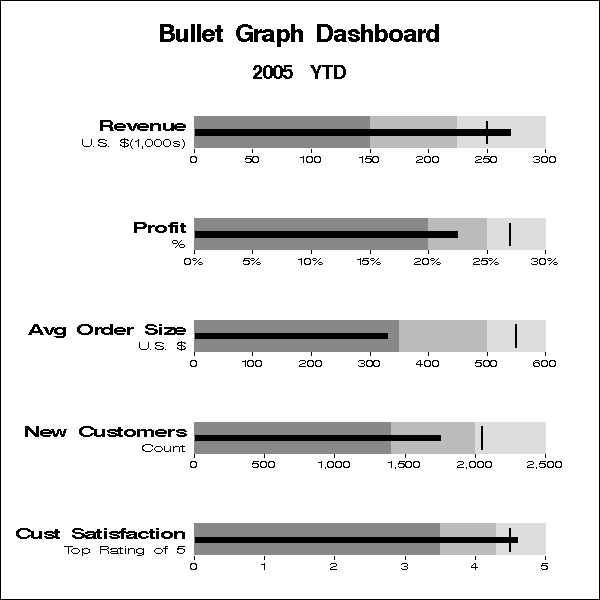
Sample 26127 - Create a dashboard with multiple bullet graph indicators for use in a portlet[ View Code ]

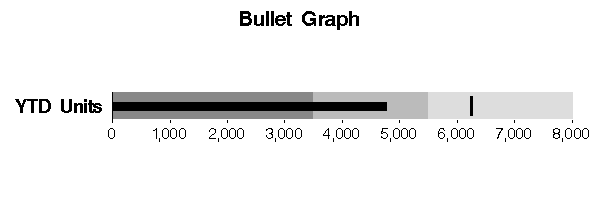
Sample 26126 - Create a bullet graph indicator for use in a portlet[ View Code ]
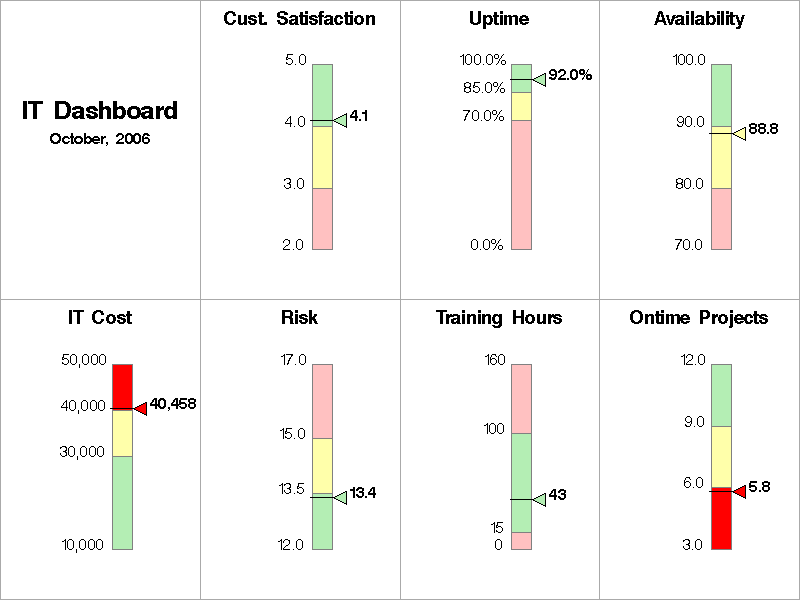
Sample 26125 - Create a dashboard with multiple slider chart indicators for use in a portlet[ View Code ]
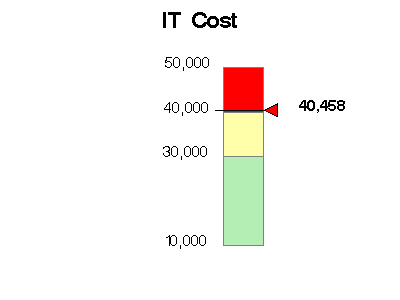
Sample 26124 - Create a slider chart indicator for use in a portlet[ View Code ]
Sample 26117 - Create a dashboard with multiple bullet graph indicators using a stored process[ View Code ]
Sample 26116 - Create a bullet graph indicator for a dashboard using a stored process[ View Code ]

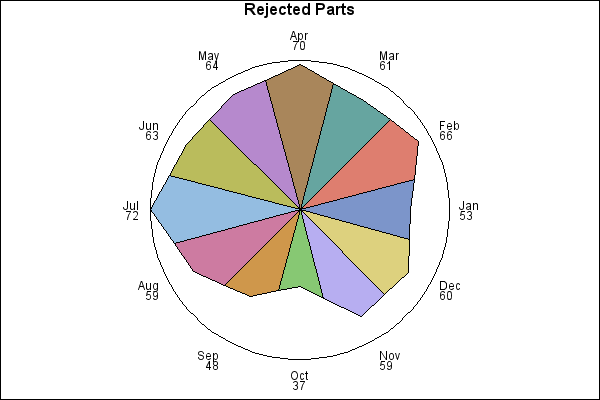
Sample 25523 - Sum statistic in a star chart using PROC GCHART[ View Code ]
Sample 25522 - Subgroup a donut or pie chart using PROC GCHART[ View Code ]
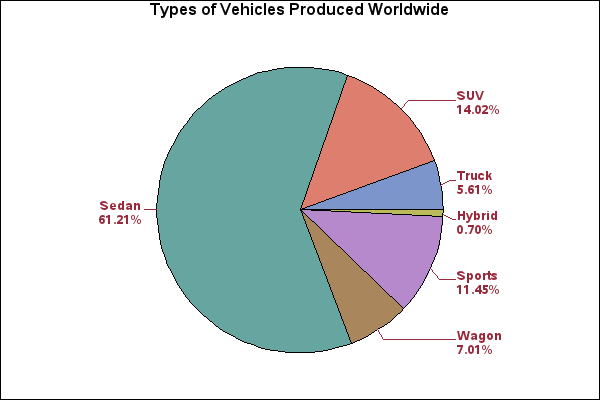
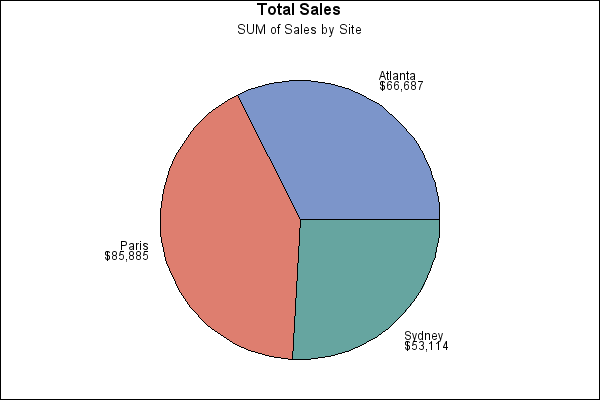
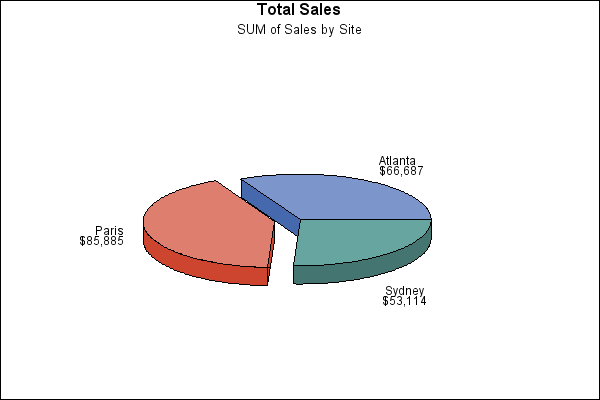
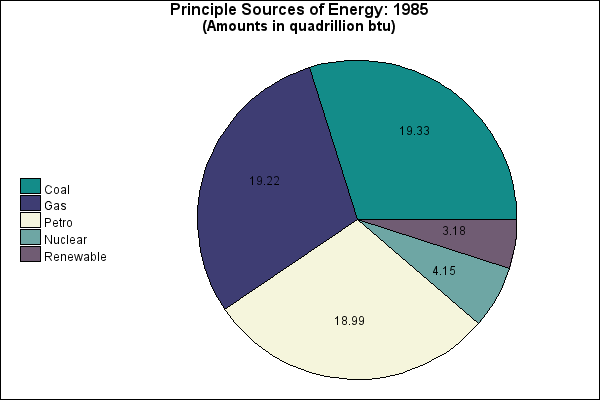
Sample 25521 - Sum statistic for a pie chart using PROC GCHART[ View Code ]
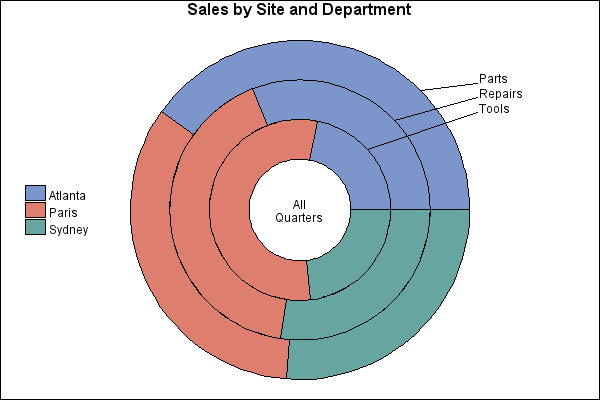
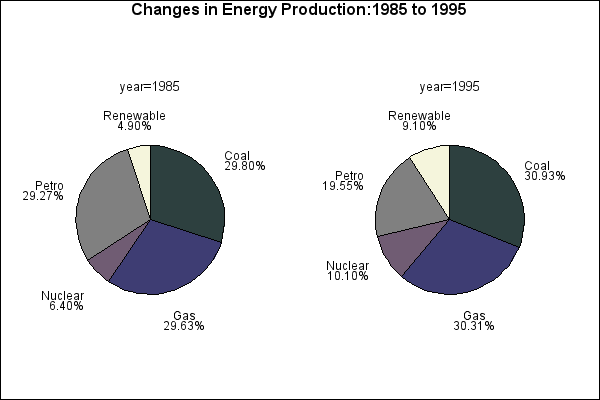
Sample 25520 - Grouping and arranging pie charts using PROC GCHART[ View Code ]
Sample 25519 - Control the midpoint order on the legend for a pie chart using the ORDER= option[ View Code ]
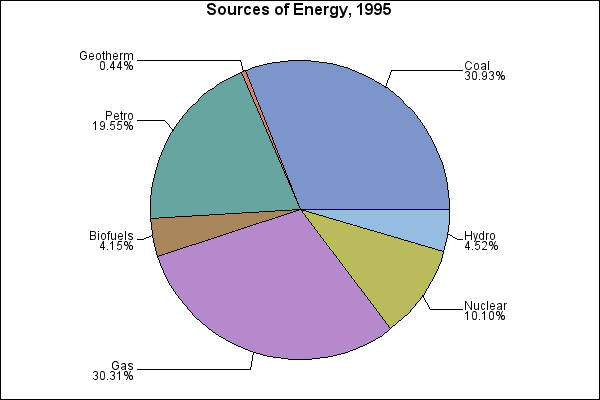
Sample 25518 - Order and label pie chart slices using PROC GCHART[ View Code ]
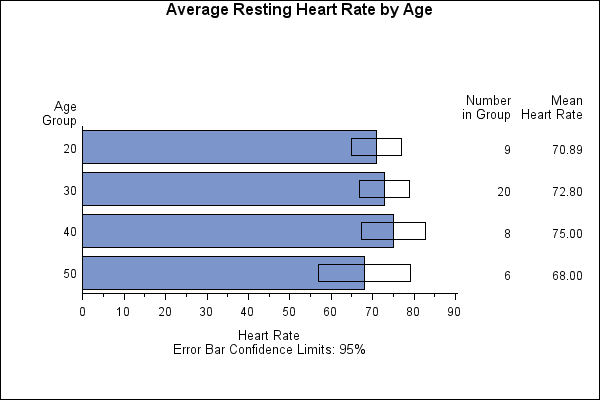
Sample 25517 - Error bars in a horizontal bar chart using PROC GCHART[ View Code ]
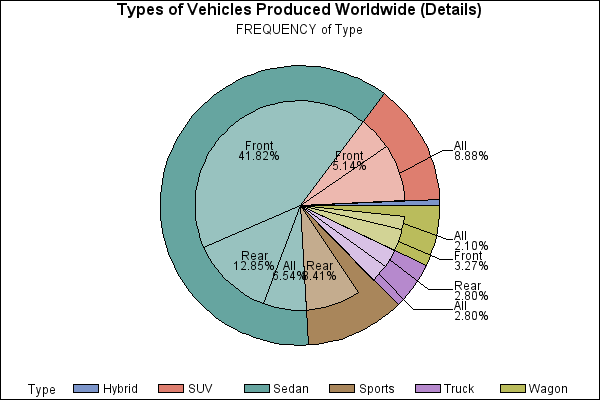
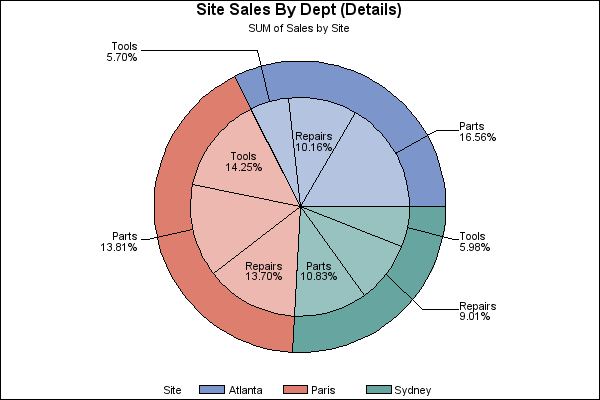
Sample 25516 - Detail pie chart using PROC GCHART[ View Code ]
Sample 25515 - Using a discrete numeric variable in a star chart with PROC GCHART[ View Code ]
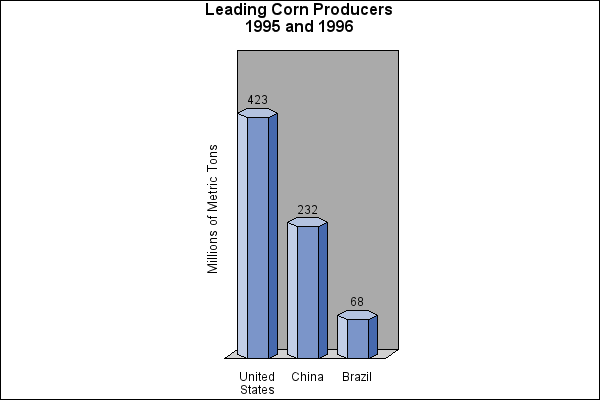
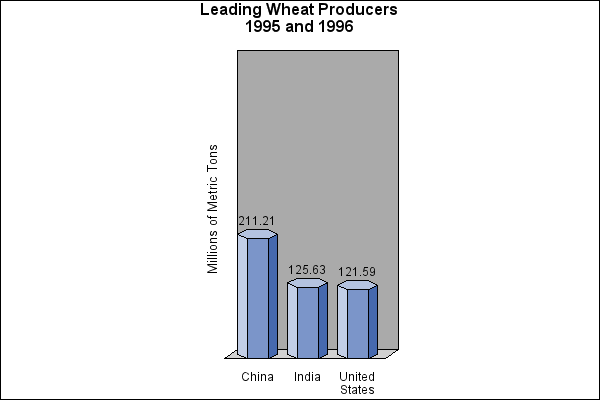
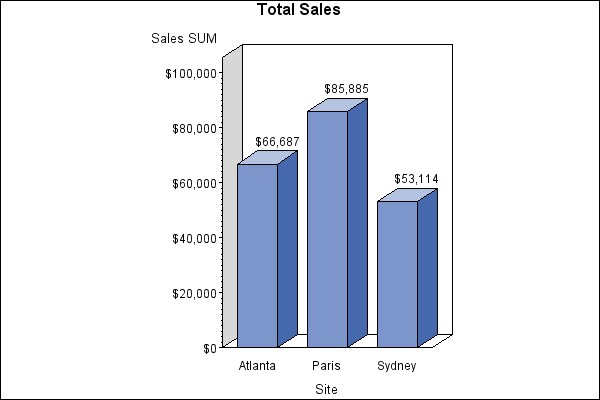
Sample 25513 - Sum statistic in bar charts using PROC GCHART[ View Code ]
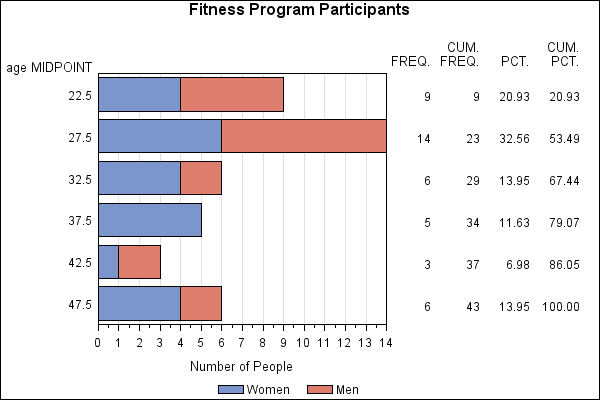
Sample 25512 - Create a horizontal bar chart with a table of descriptive statistics with PROC GCHART[ View Code ]
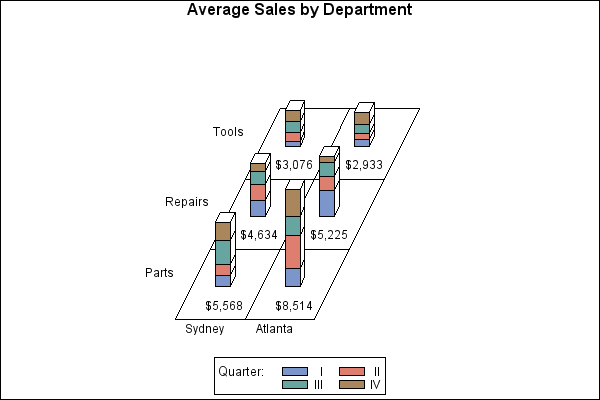
Sample 25511 - Subgroup a 3D vertical bar chart using PROC GCHART[ View Code ]

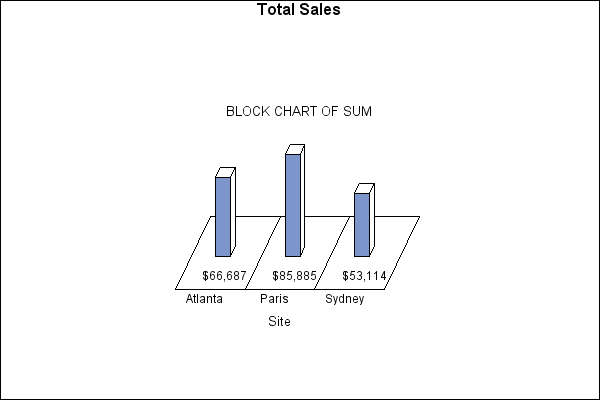
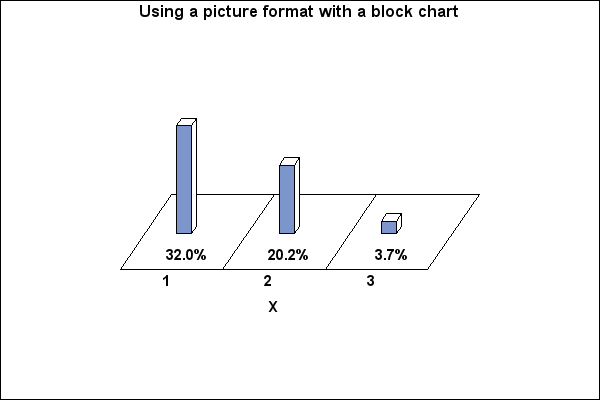
Sample 25510 - Sum statistic in a block chart using PROC GCHART[ View Code ]
Sample 25509 - Grouping and subgrouping a block chart using PROC GCHART[ View Code ]
Sample 25504 - Label subgroups in a vertical bar chart using PROC GCHART[ View Code ]
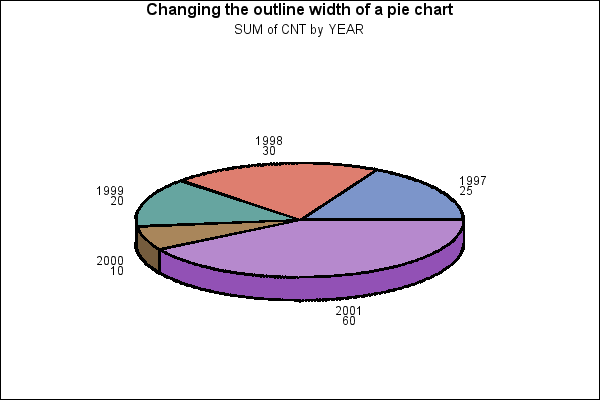
Sample 24890 - Change the outline width on a pie chart with PROC GCHART[ View Code ]
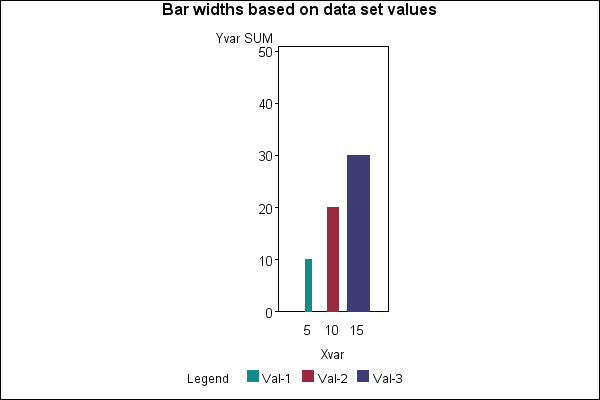
Sample 24889 - Control the width of bars based on a data set value with PROC GCHART[ View Code ]
Sample 24888 - Use Annotation to add labeled reference lines to PROC GCHART output [ View Code ]
Sample 24887 - Annotate values for each subgroup bar with PROC GCHART[ View Code ]
Sample 24886 - Annotate values above each midpoint bar with PROC GCHART[ View Code ]
Sample 24885 - Use PROC GCHART to label midpoint values longer than 32 characters[ View Code ]
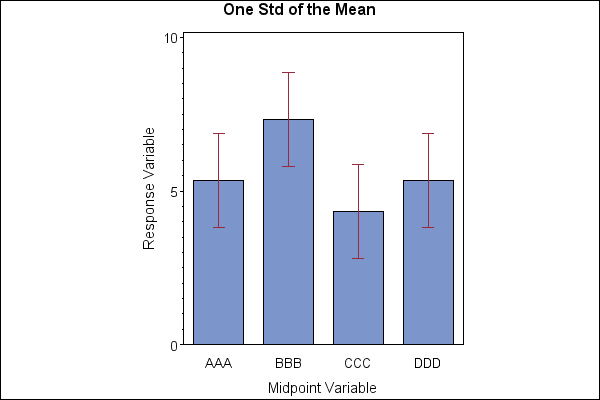
Sample 24884 - Annotate +/- one standard deviation of the mean with PROC GCHART - Example 2[ View Code ]
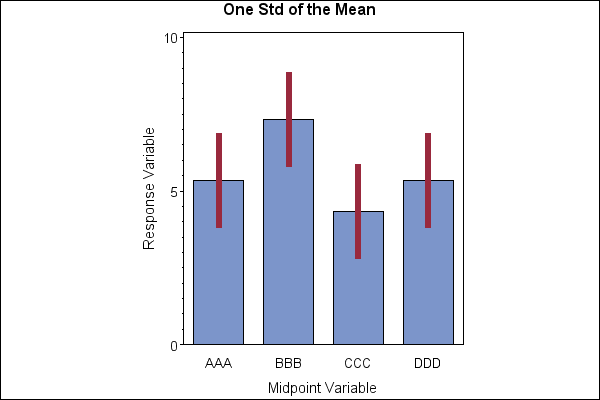
Sample 24883 - Annotate +/- one standard deviation of the mean with PROC GCHART[ View Code ]
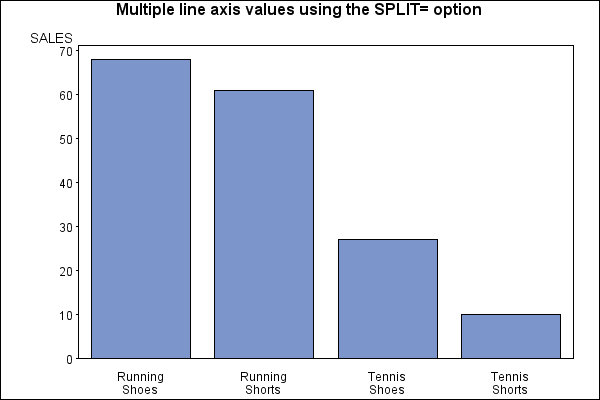
Sample 24882 - Display multiple lines of text for axis values with PROC GCHART[ View Code ]
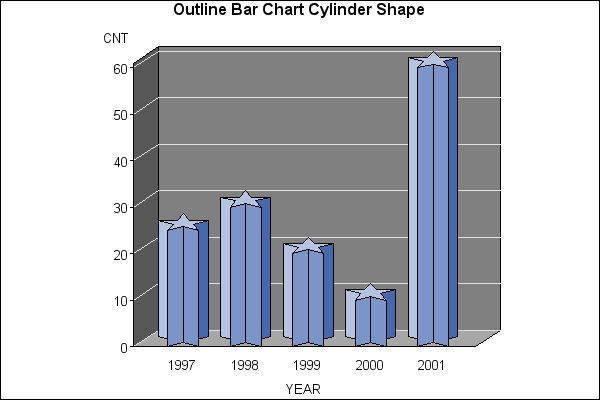
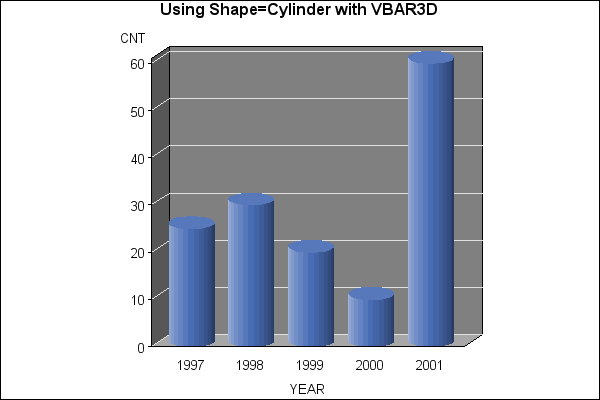
Sample 24881 - Control the shape of a 3D bar chart with PROC GCHART[ View Code ]
Sample 24880 - Reorder the subgroups in a stacked bar chart produced with PROC GCHART[ View Code ]
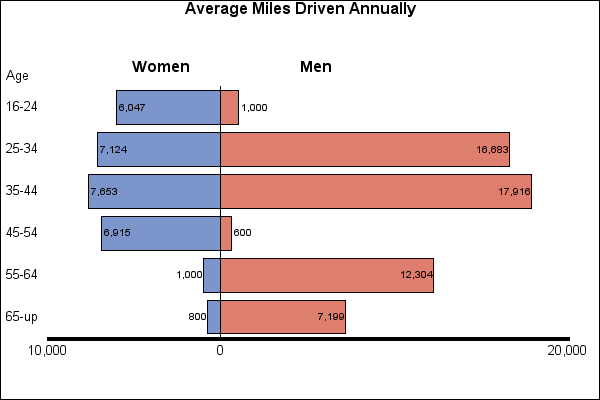
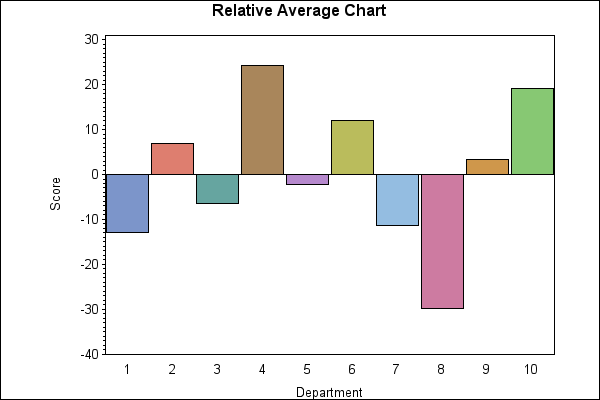
Sample 24879 - Create a relative average chart[ View Code ]
Sample 24877 - Format percentage values on a pie chart with PROC GCHART[ View Code ]
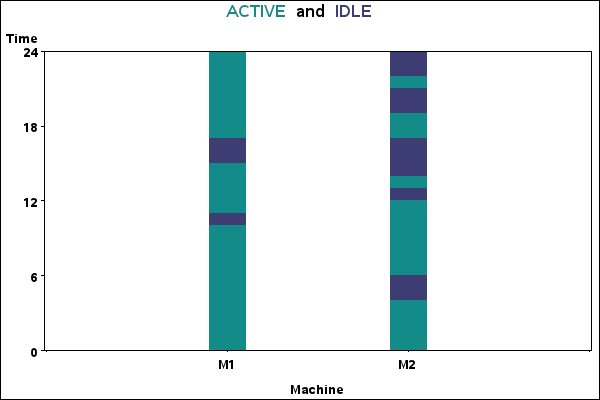
Sample 24876 - Stacked bar chart representing on/off states of a constant[ View Code ]
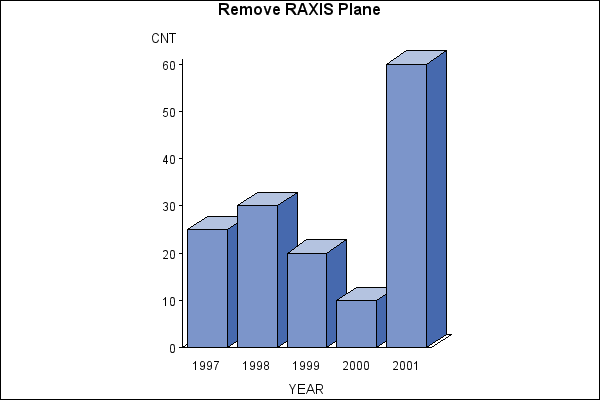
Sample 24875 - Remove RAXIS plane from a VBAR3D[ View Code ]
Sample 24873 - Control the placement of statistics with PROC GCHART[ View Code ]
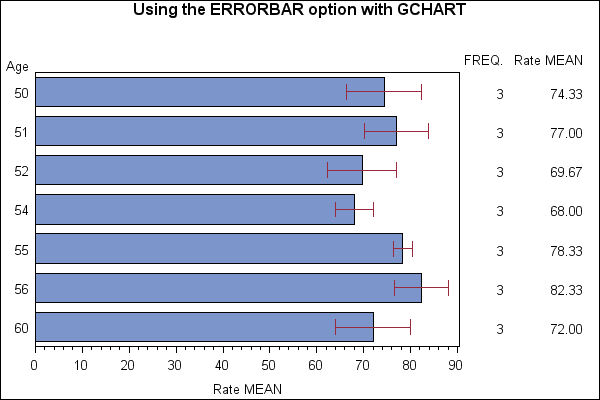
Sample 24872 - Produce one standard error with the ERRORBAR option with PROC GCHART[ View Code ]
Sample 24871 - Use PROC GCHART with Annotate to add bars at +/- 1, 2 or 3 STD or STDERR of the mean[ View Code ]
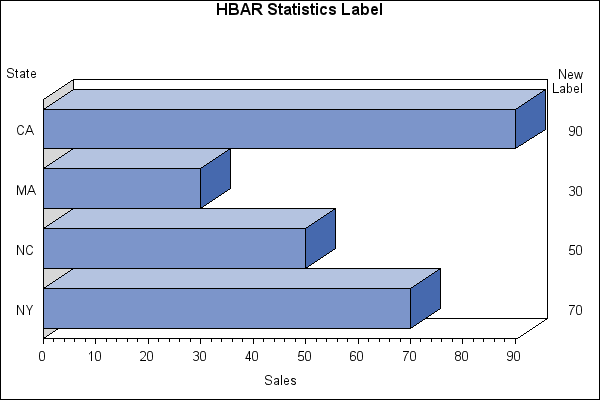
Sample 24870 - Modify the HBAR statistics label with PROC GCHART[ View Code ]
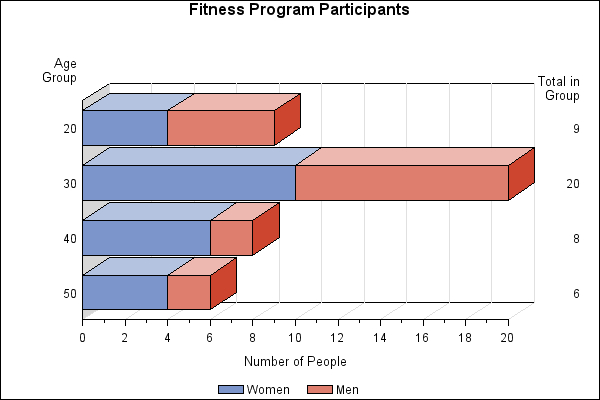
Sample 24869 - Reflect contribution of the midpoint to the group[ View Code ]
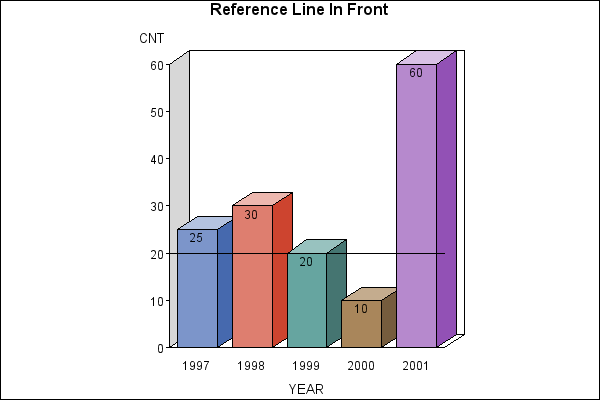
Sample 24868 - Place a reference line in front of the bars with PROC GCHART[ View Code ]
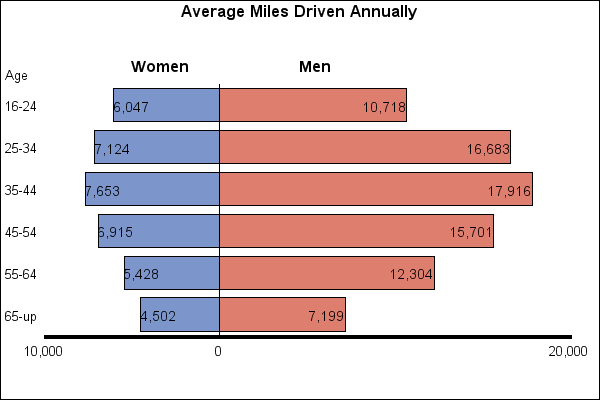
Sample 24867 - Produce and label a population tree[ View Code ]
Sample 24866 - Format the SUMVAR variable when using the BLOCK statement with PROC GCHART[ View Code ]
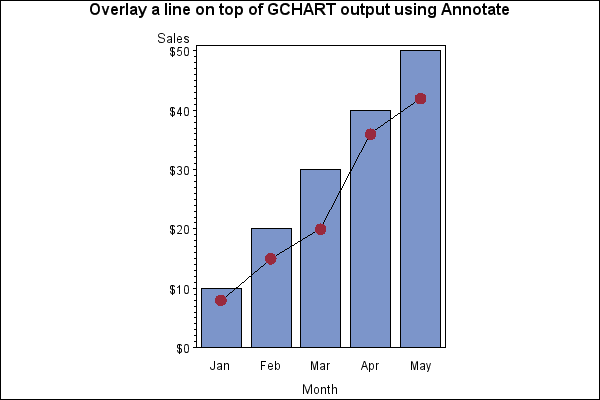
Sample 24865 - Overlay a plot line on a vertical bar chart[ View Code ]
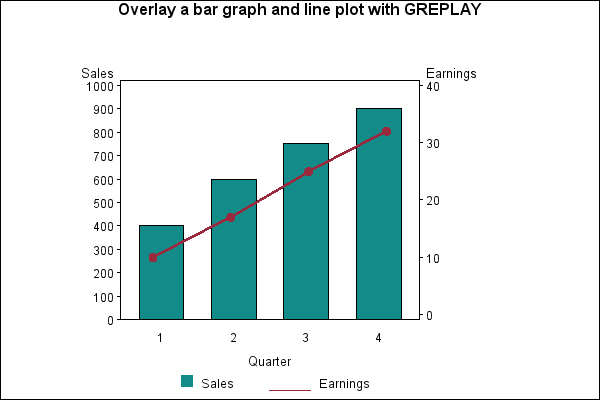
Sample 24864 - Overlay a vertical bar chart with a plot line and a right vertical axis with PROC GREPLAY[ View Code ]
Sample 24856 - Use PROC GCHART with midpoint values longer than 16 characters[ View Code ]