FOCUS AREAS

SAS/ETS® Examples of ODS Graphics

Unpacking Diagnostics Panels with PROC VARMAX [View Code]

Figure 1: Prediction Errors

Prediction Errors for ELECTRIC

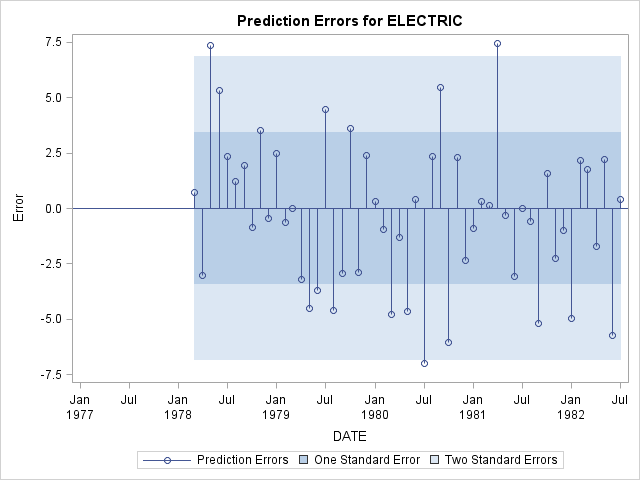
Figure 2: Prediction Error Autocorrelations

Prediction Error Autocorrelations for ELECTRIC

Figure 3: Prediction Error Partial Autocorrelations

Prediction Error Partial Autocorrelations for ELECTRIC

Figure 4: Prediction Error Inverse Autocorrelations

Prediction Error Inverse Autocorrelations for ELECTRIC

Figure 5: Prediction Error White Noise Plot

Prediction Error White Noise Plot for ELECTRIC (Log Scale)

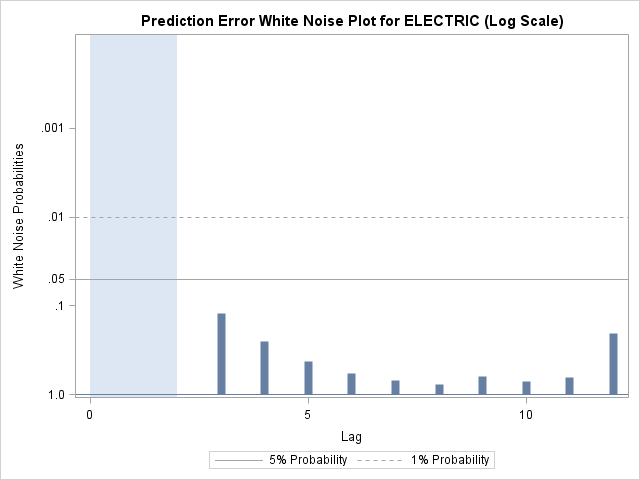
Figure 6: Distribution of Prediction Errors

Distribution of Prediction Errors  for ELECTRIC

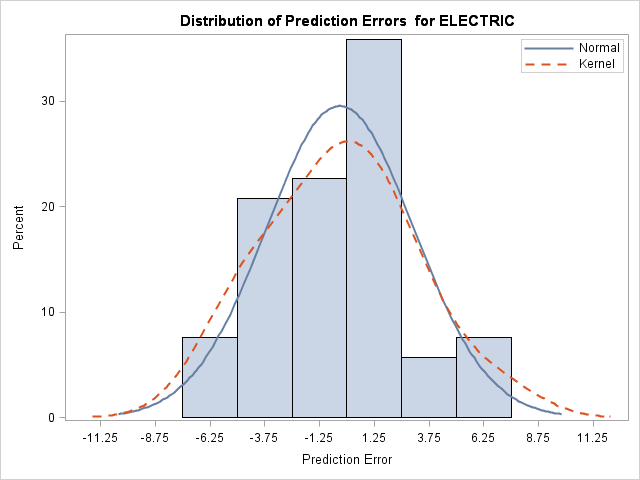
Figure 7: Prediction Error Q-Q Plot
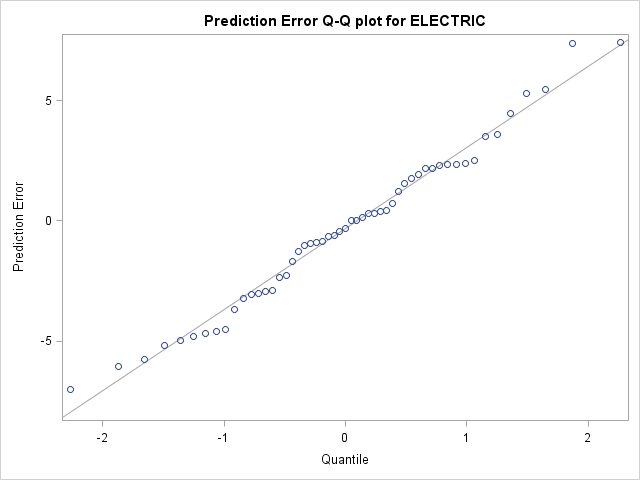
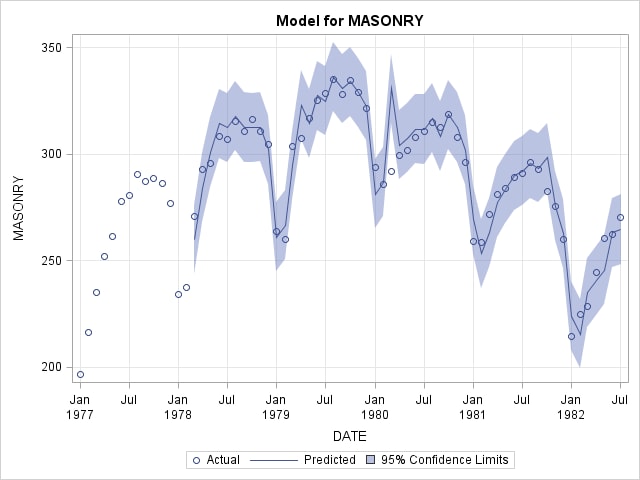
Prediction Error Q-Q plot for ELECTRIC

Figure 8: Model

Model for ELECTRIC

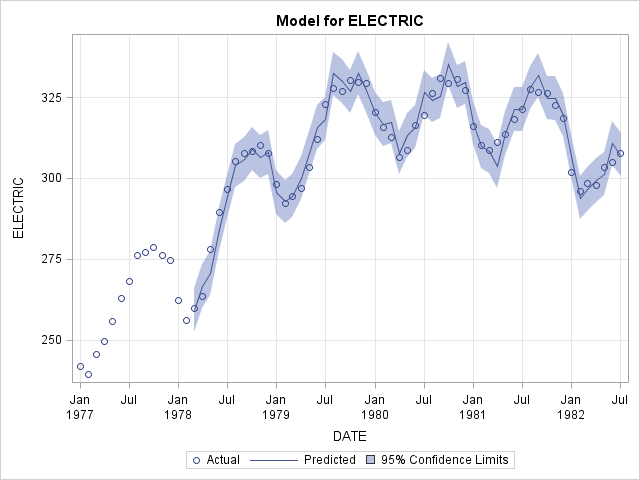
Figure 9: Prediction Errors

Prediction Errors for MASONRY

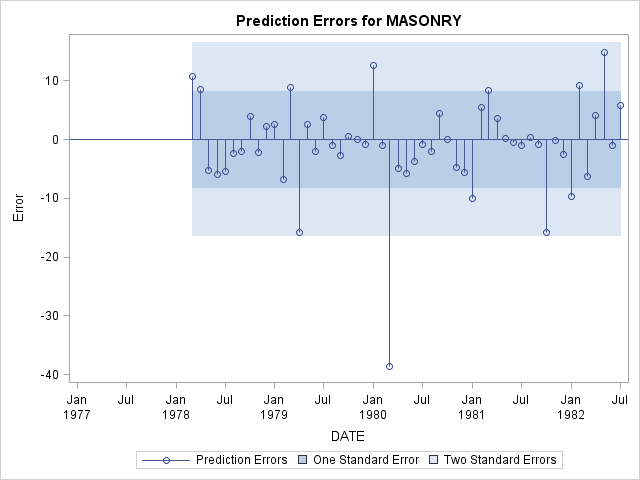
Figure 10: Prediction Error Autocorrelations

Prediction Error Autocorrelations for MASONRY

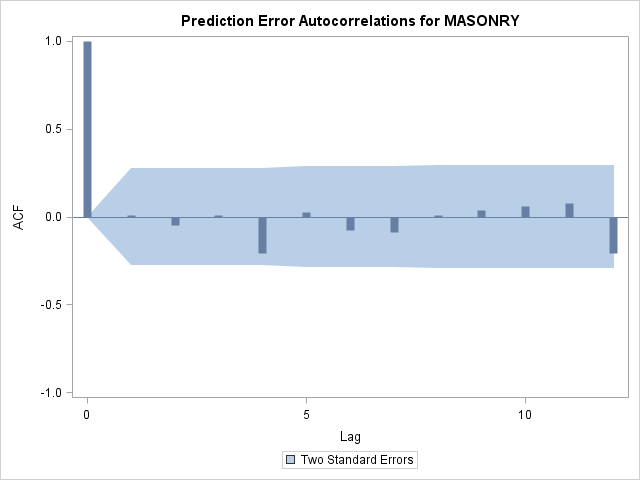
Figure 11: Prediction Error Partial Autocorrelations

Prediction Error Partial Autocorrelations for MASONRY

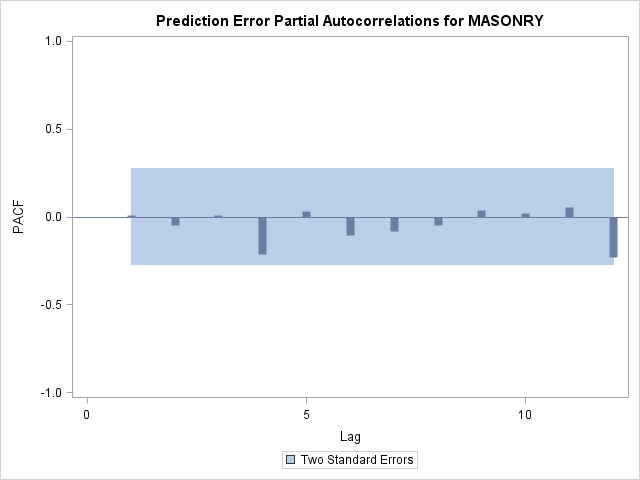
Figure 12: Prediction Error Inverse Autocorrelations

Prediction Error Inverse Autocorrelations for MASONRY

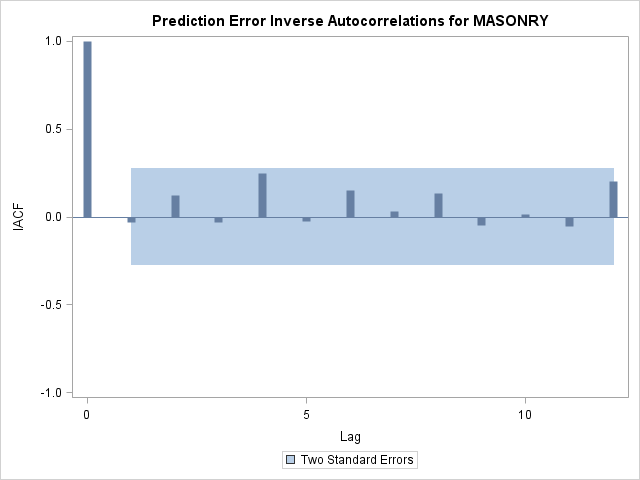
Figure 13: Prediction Error White Noise Plot

Prediction Error White Noise Plot for MASONRY (Log Scale)

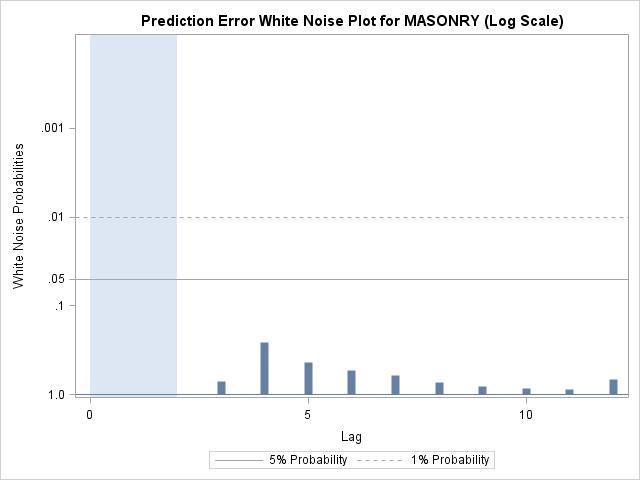
Figure 14: Distribution of Prediction Errors

Distribution of Prediction Errors  for MASONRY

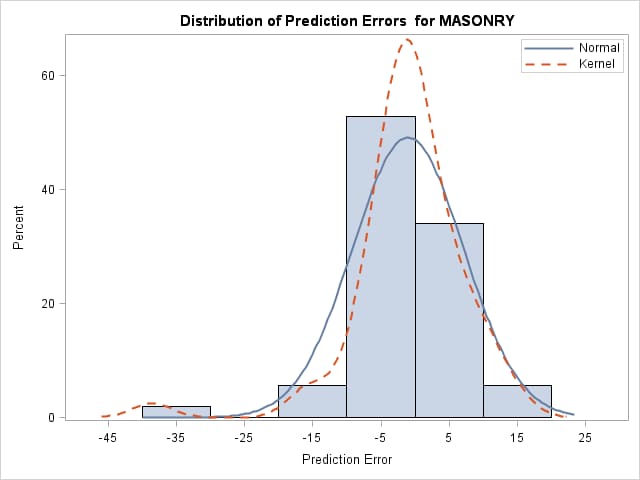
Figure 15: Prediction Error Q-Q Plot
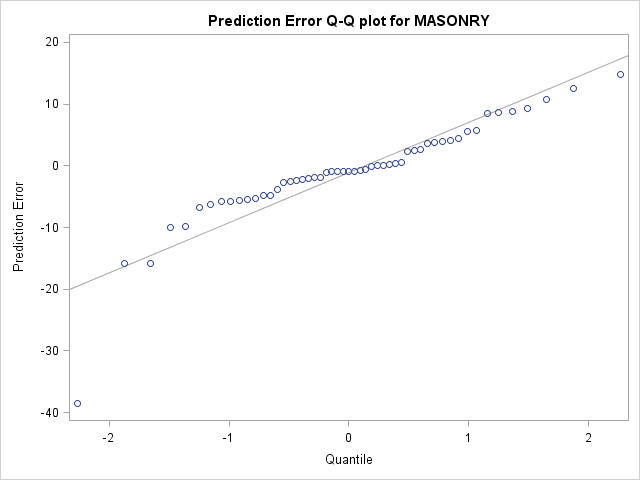
Prediction Error Q-Q plot for MASONRY

Figure 16: Model

Model for MASONRY

Statistics and Operations Research Home Page