SAS/ETS® Examples of ODS Graphics
Residuals and Q-Q Plots Plots for Klein's Model I with PROC SYSLIN [View Code]
Figure 1: Residuals Diagnostic Plot for Consumption
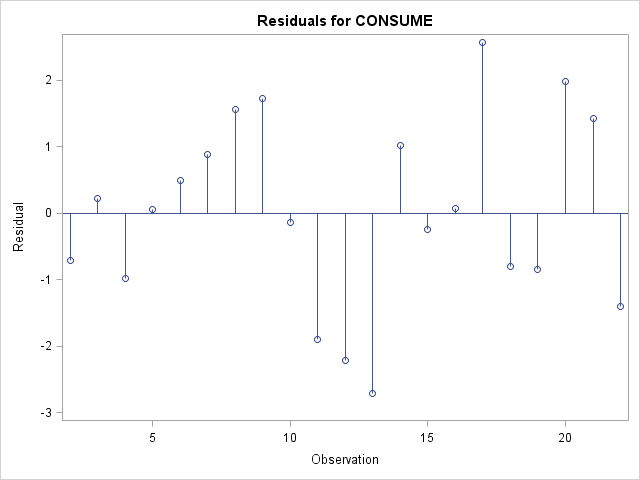
Figure 2: Q-Q Plot of Residuals for Consumption
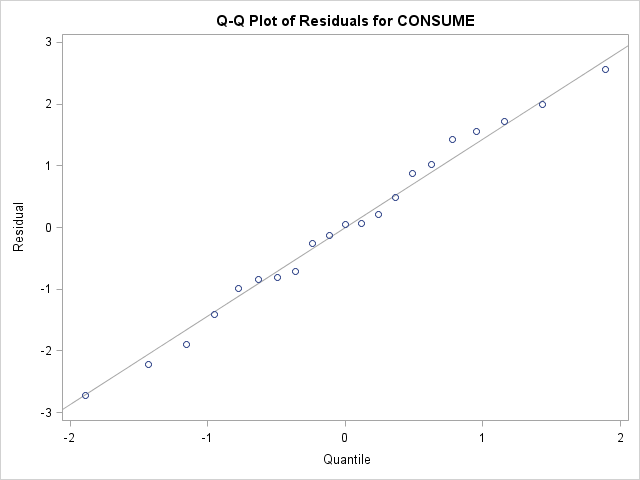
Figure 3: Residuals Diagnostic Plot for Investment
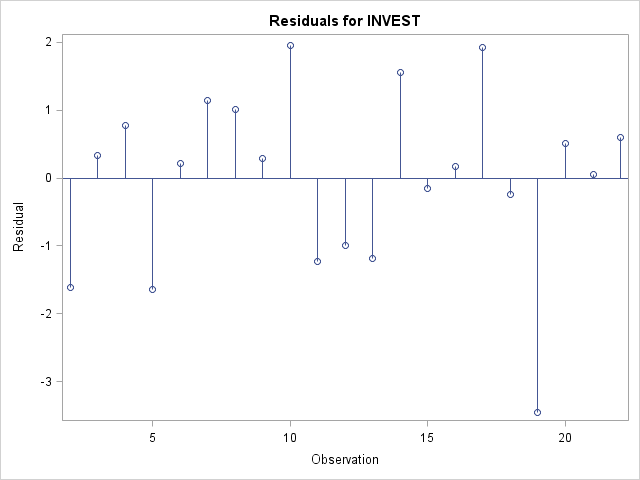
Figure 4: Q-Q Plot of Residuals for Investment
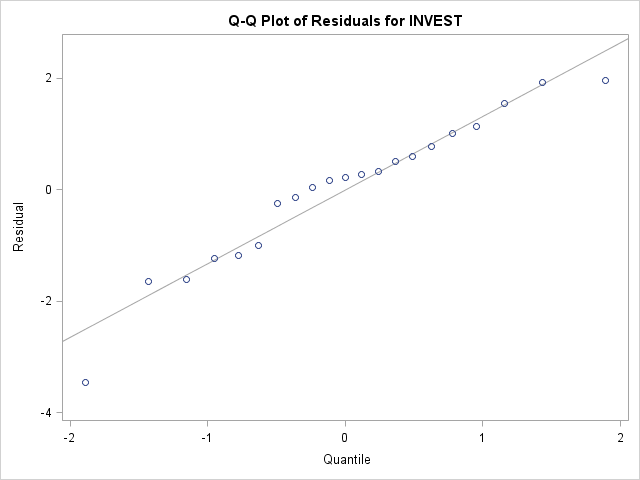
Figure 5: Residuals Diagnostic Plot for Labor
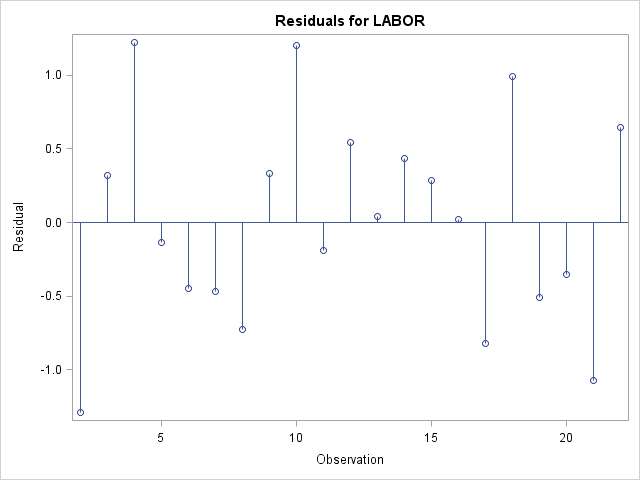
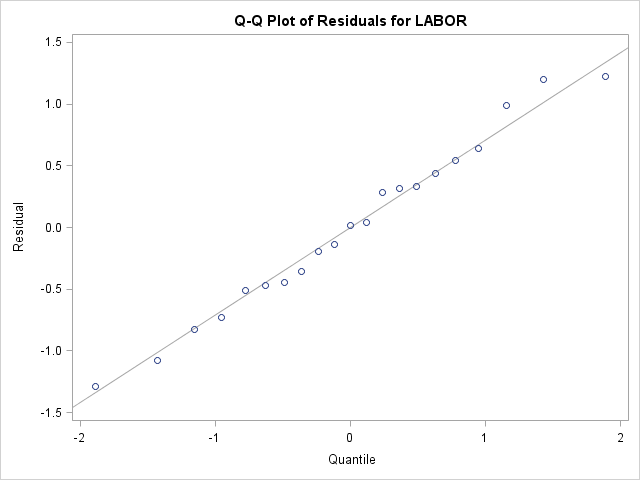
Figure 6: Q-Q Plot of Residuals for Labor