FOCUS AREAS
Base SAS
Graphics
Enterprise Management Integration
Migration
Scalability & Performance
SAS for Containers
Statistics & Operations Research
SAS/STAT
®
Examples of ODS Graphics
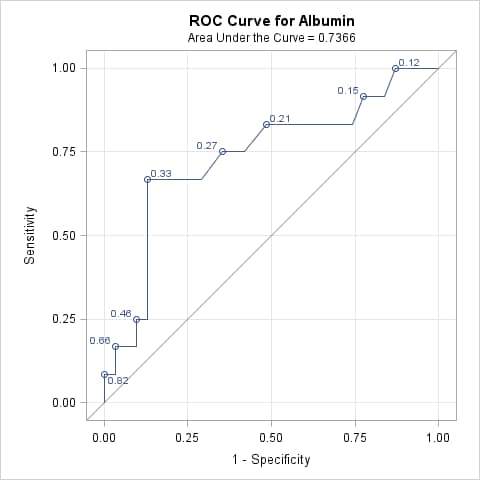
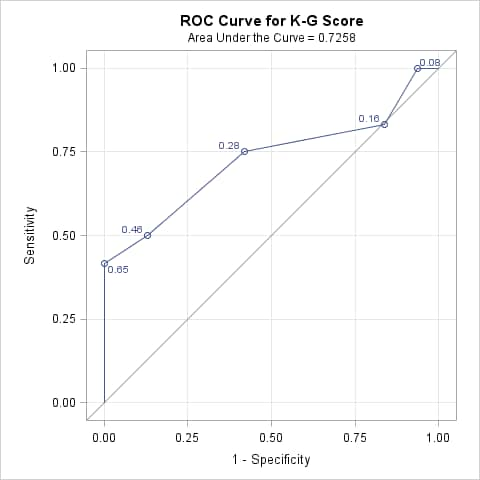
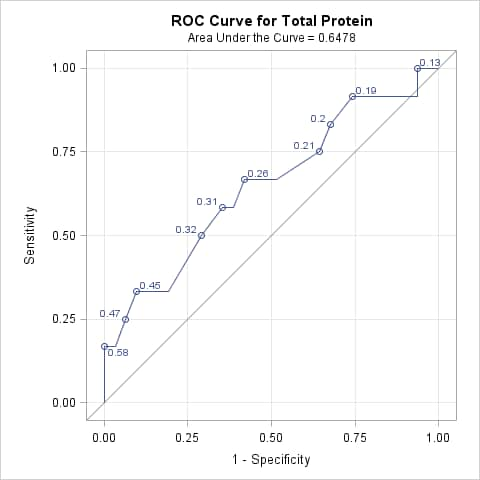
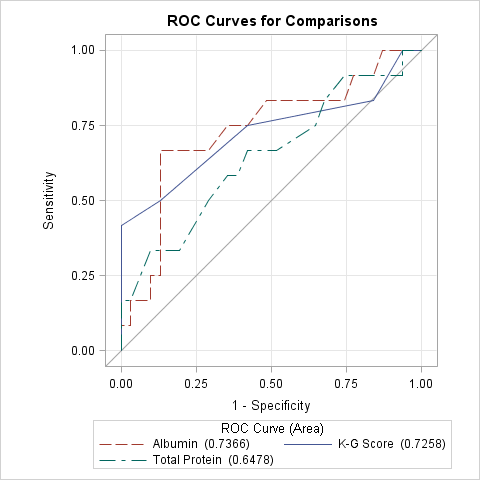
ROC Curves with PROC LOGISTIC [
View Code
]
Figure 1: ROC Curve for Albumin
Figure 2: ROC Curve for K-G Score
Figure 3: ROC Curve for Total Protein
Figure 4: ROC Curves for Comparisons
Statistics and Operations Research Home Page