FOCUS AREAS
Base SAS
Graphics
Enterprise Management Integration
Migration
Scalability & Performance
SAS for Containers
Statistics & Operations Research
SAS/STAT
®
Examples of ODS Graphics
Diagnostic Plots for Simple Linear Regression with PROC REG [
View Code
]
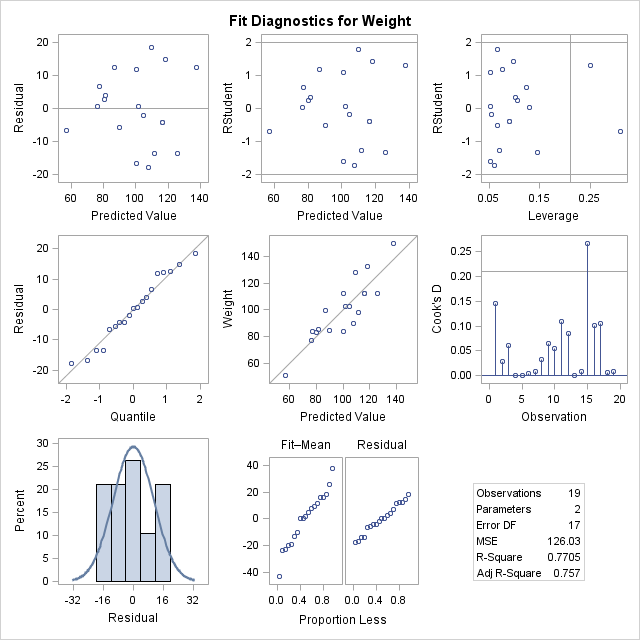
Figure 1: Fit Diagnostics Panel
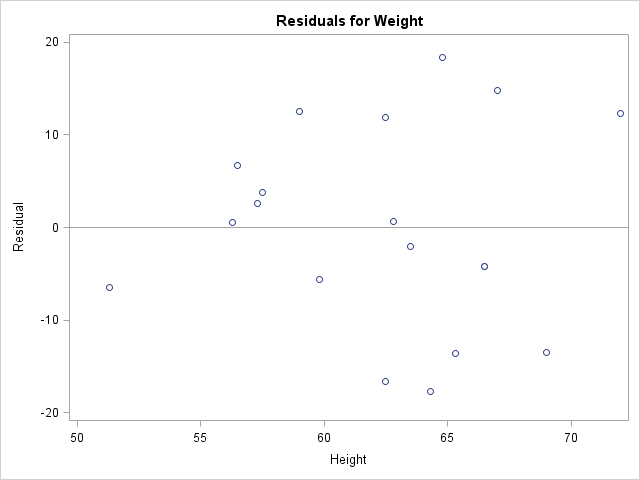
Figure 2: Residual Plot
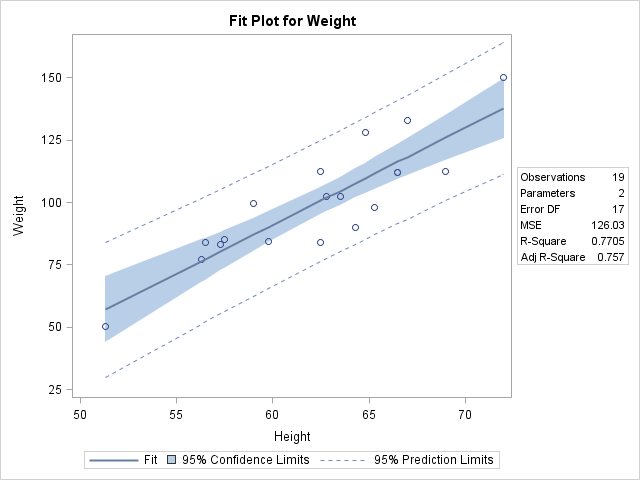
Figure 3: Fit Plot
Statistics and Operations Research Home Page