FOCUS AREAS
Base SAS
Graphics
Enterprise Management Integration
Migration
Scalability & Performance
SAS for Containers
Statistics & Operations Research
SAS/STAT
®
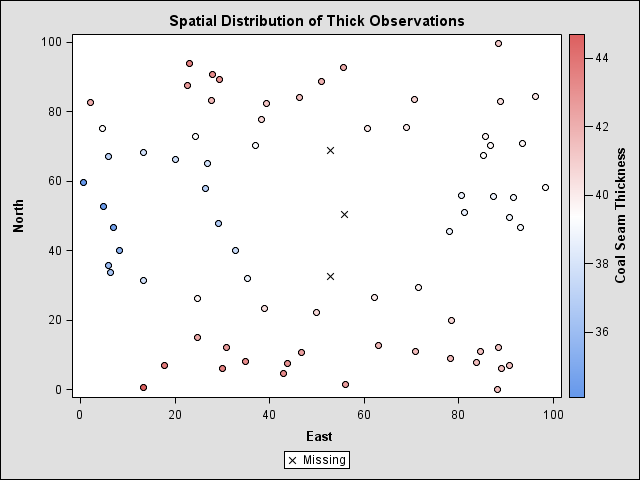
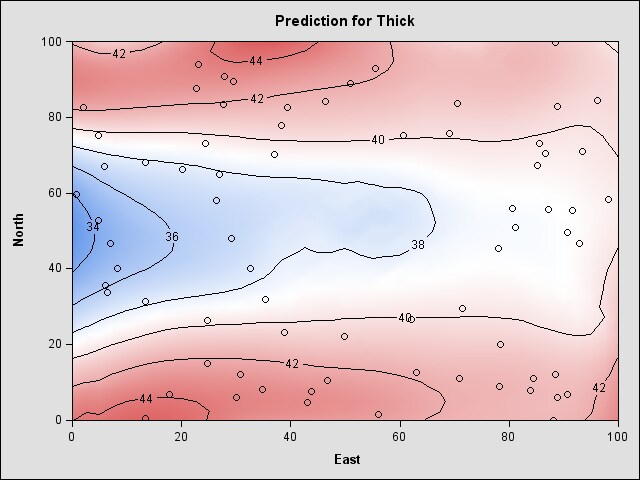
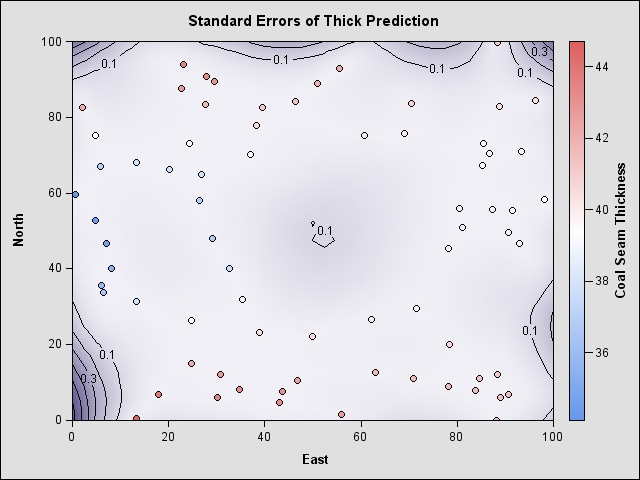
Examples of ODS Graphics
Contour Plots with PROC KRIGE2D [
View Code
]
Figure 1: PROC KRIGE2D Results Using the Default Style
Statistics and Operations Research Home Page