SAS/STAT® Examples of ODS Graphics
Risk Differences, Odds Ratios, and Relative Risks Plots with PROC FREQ [View Code]
Figure 1: Plot of Risk Differences with 95% Confidence Limits
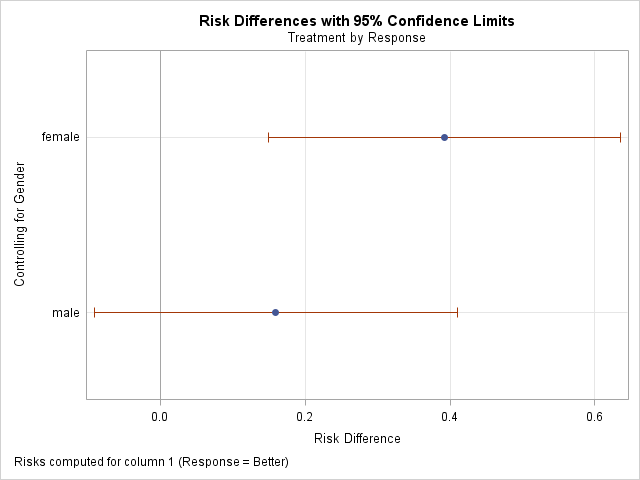
Figure 2: Plot of Odds Ratios with 95% Confidence Limits
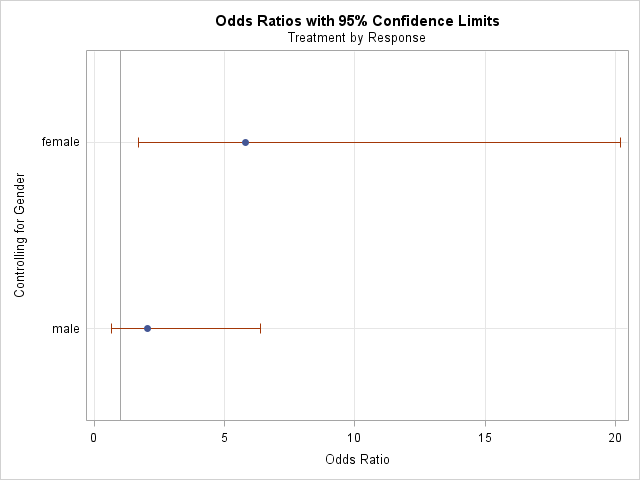
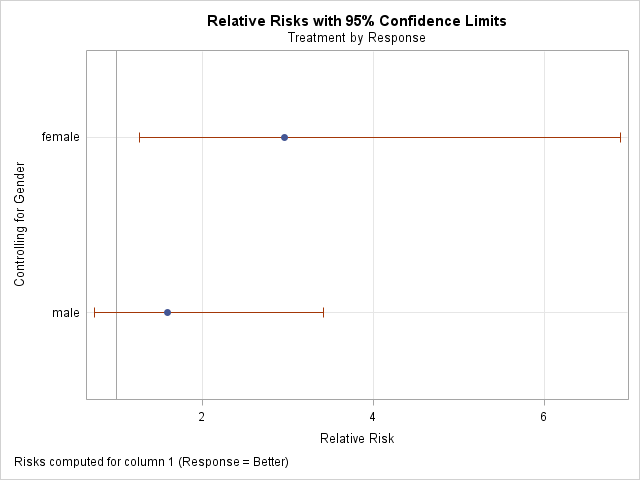
Figure 3: Plot of Relative Risks with 95% Confidence Limits