FOCUS AREAS
Base SAS
Graphics
Enterprise Management Integration
Migration
Scalability & Performance
SAS for Containers
Statistics & Operations Research
SAS/ETS
®
Examples of ODS Graphics
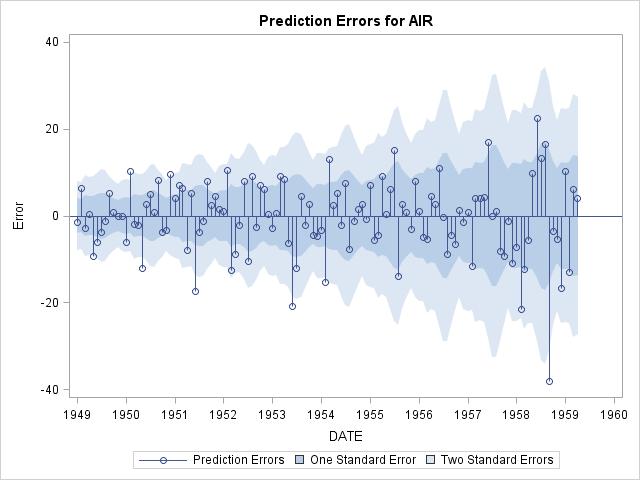
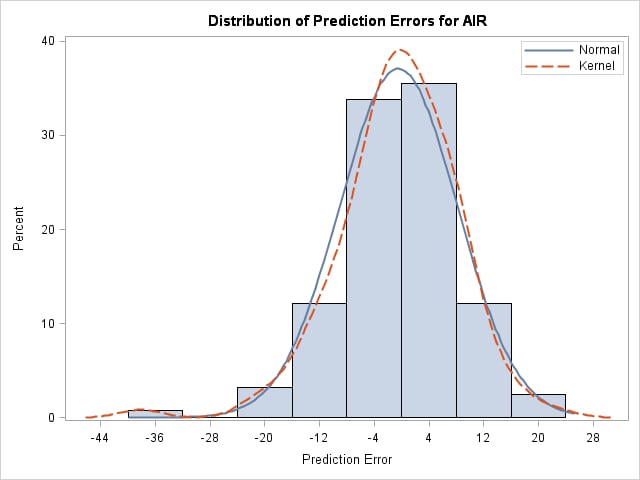
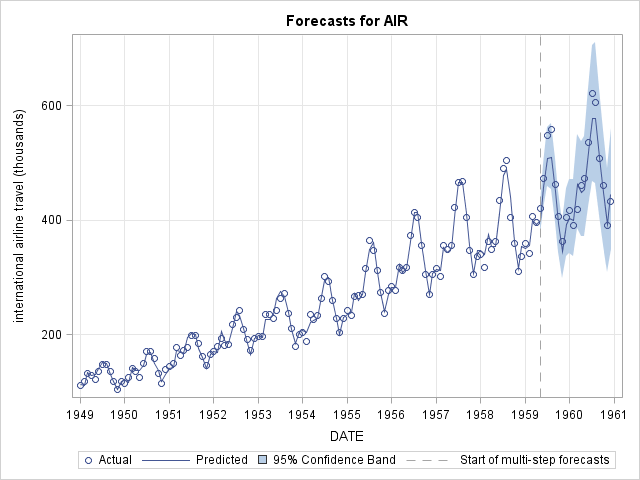
Forecasts and Prediction Errors with PROC ESM [
View Code
]
Figure 1: Prediction Error Plot
Figure 2: Prediction Error Histogram
Figure 3:Forecasts Plot
Statistics and Operations Research Home Page