FOCUS AREAS
Base SAS
Graphics
Enterprise Management Integration
Migration
Scalability & Performance
SAS for Containers
Statistics & Operations Research
SAS/STAT
®
Examples of ODS Graphics
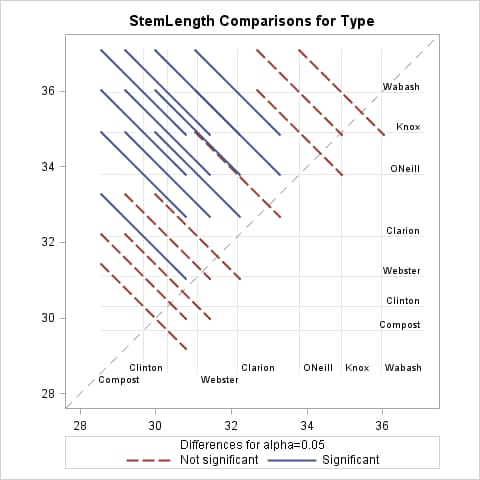
LS-Means Diffogram with PROC GLIMMIX [
View Code
]
Figure 1: LS-Means Diffogram Using the STATISTICAL Style
Statistics and Operations Research Home Page