SAS/ETS® Examples of ODS Graphics
Diagnostic Plots with PROC AUTOREG
[View Code]
Figure 1: Panel of Fit Diagnostics Plots
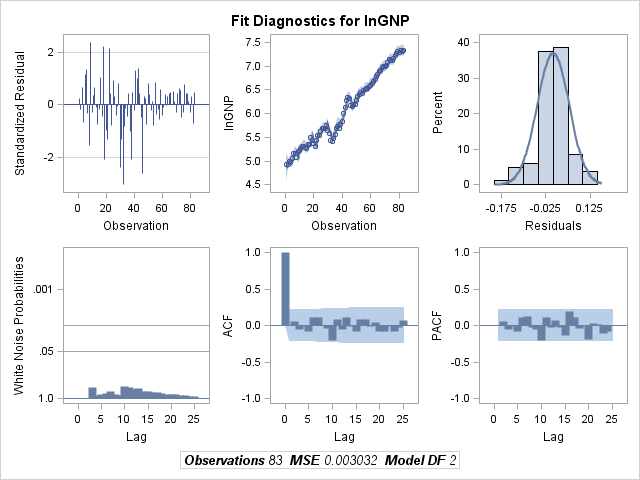
Figure 2: Plot of Standardized Residuals
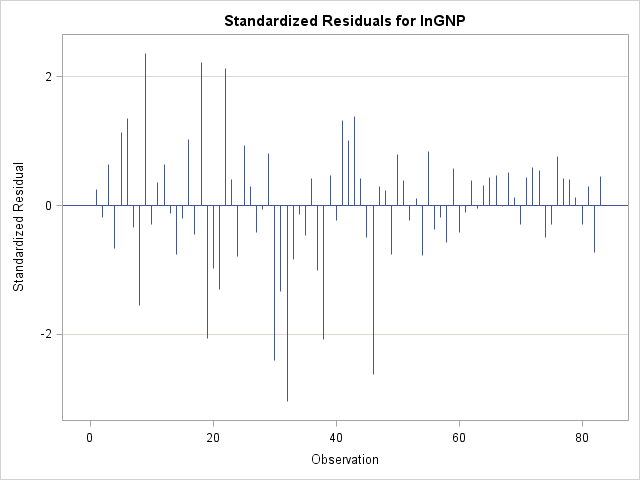
Figure 3: Plot of Actual and Predicted Values with 95% Lower and Upper Confidence Limits
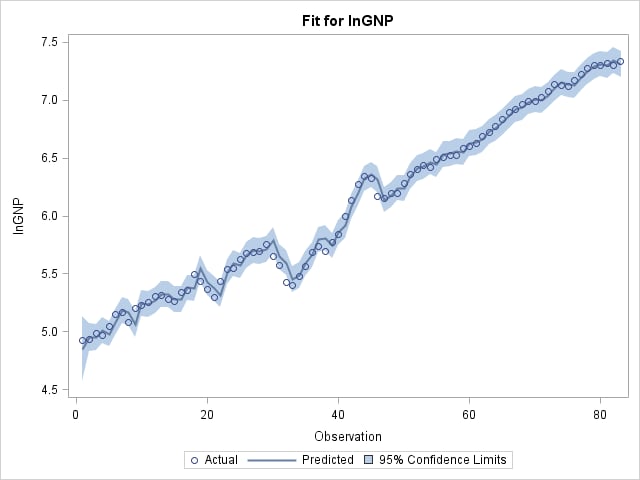
Figure 4: Histogram of Residuals with Normal and Kernel Densities Overlaid
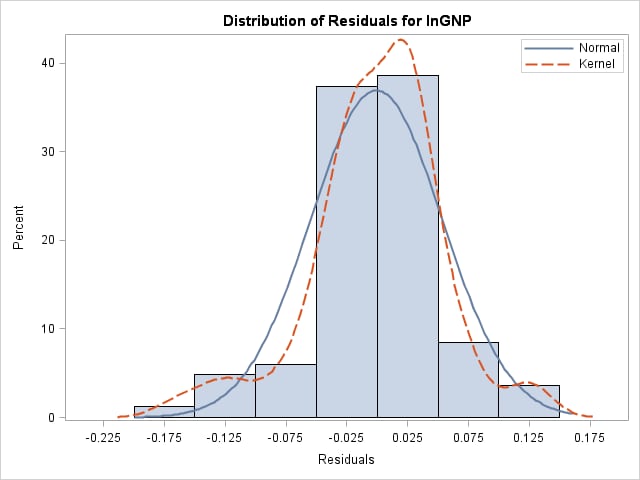
Figure 5: Plot of Residual White Noise Test Probabilities
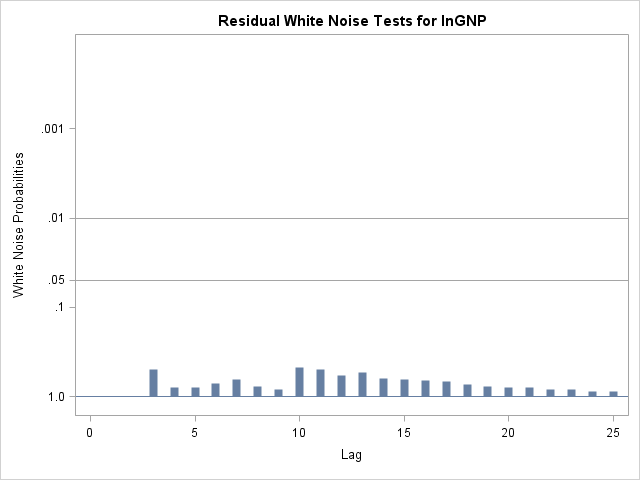
Figure 6: Plot of Autocorrelation of Residuals with Two Standard Error Bands
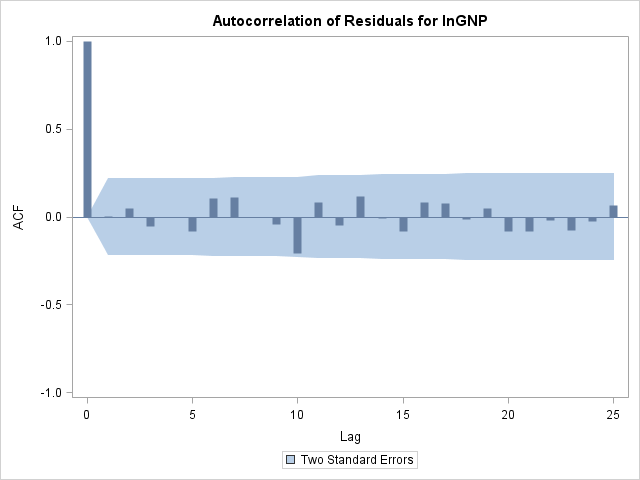
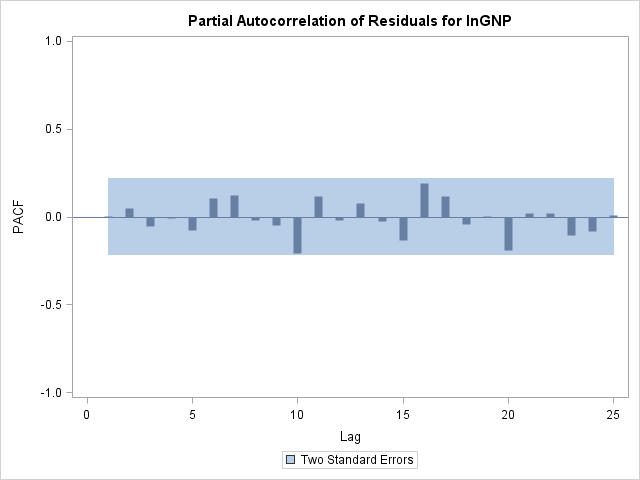
Figure 7: Plot of Partial Autocorrelation of Residuals with Two Standard Error Bands