FOCUS AREAS
Base SAS
Graphics
Enterprise Management Integration
Migration
Scalability & Performance
SAS for Containers
Statistics & Operations Research
SGPLOT Procedure Examples
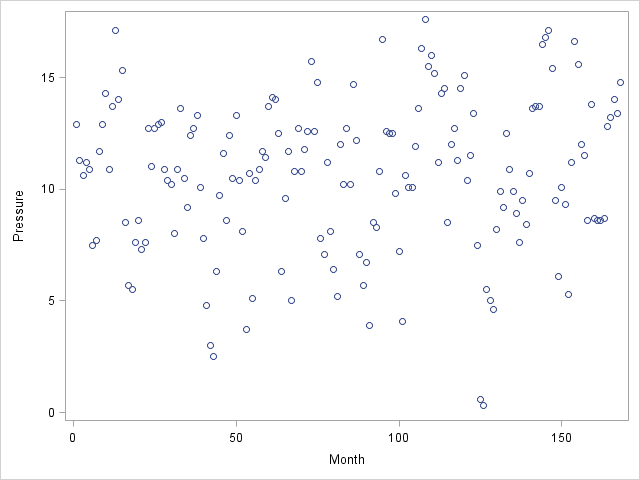
Scatter Plot with PROC SGPLOT [
View Code
]
Figure 1: Scatter Plot of ENSO Data
Statistics and Operations Research Home Page