The FREQ Procedure

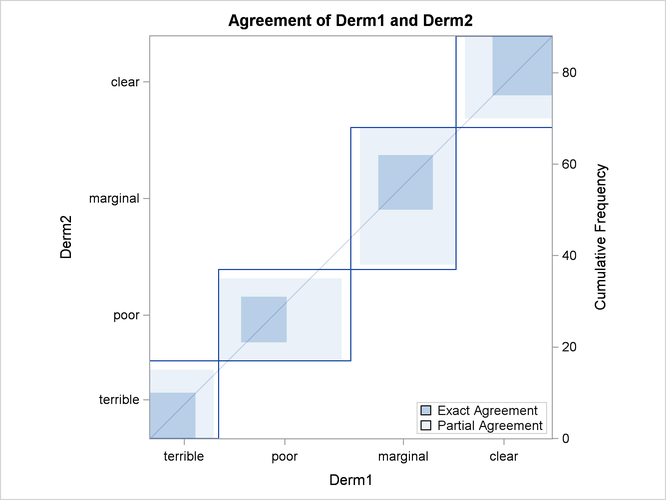
Medical researchers are interested in evaluating the efficacy of a new treatment for a skin condition. Dermatologists from participating clinics were trained to conduct the study and to evaluate the condition. After the training, two dermatologists examined patients with the skin condition from a pilot study and rated the same patients. The possible evaluations are terrible, poor, marginal, and clear. Table 40.2 contains the data.
Table 40.2: Skin Condition Data
|
Dermatologist 2 |
||||||||||||
|---|---|---|---|---|---|---|---|---|---|---|---|---|
|
Dermatologist 1 |
Terrible |
Poor |
Marginal |
Clear |
||||||||
|
Terrible |
10 |
4 |
1 |
0 |
||||||||
|
Poor |
5 |
10 |
12 |
2 |
||||||||
|
Marginal |
2 |
4 |
12 |
5 |
||||||||
|
Clear |
0 |
2 |
6 |
13 |
||||||||
The following DATA step statements create the SAS dataset SkinCondition. The dermatologists’ evaluations of the patients are contained in the variables Derm1 and Derm2; the variable Count is the number of patients given a particular pair of ratings.
data SkinCondition;
   input Derm1 $ Derm2 $ Count;
   datalines;
terrible terrible 10
terrible     poor 4
terrible marginal 1
terrible    clear 0
poor     terrible 5
poor         poor 10
poor     marginal 12
poor        clear 2
marginal terrible 2
marginal     poor 4
marginal marginal 12
marginal    clear 5
clear    terrible 0
clear        poor 2
clear    marginal 6
clear       clear 13
;
The following PROC FREQ statements request an agreement analysis of the skin condition data. In order to evaluate the agreement of the diagnoses (a possible contribution to measurement error in the study), the kappa coefficient is computed.
The TABLES statement requests a crosstabulation of the variables Derm1 and Derm2. The AGREE option in the TABLES statement requests the kappa coefficient, together with its standard error and confidence
limits. The KAPPA option in the TEST statement requests a test for the null hypothesis that kappa equals zero, or that the
agreement is purely by chance. The NOPRINT option in the TABLES statement suppresses the display of the two-way table. The
PLOTS= option requests an agreement plot for the two dermatologists. ODS Graphics must be enabled before producing plots.
ods graphics on;
proc freq data=SkinCondition order=data;
   tables Derm1*Derm2 /
          agree noprint plots=agreeplot;
   test kappa;
   weight Count;
run;
ods graphics off;
Figure 40.10 and Figure 40.11 show the results. The kappa coefficient has the value 0.3449, which indicates some agreement between the dermatologists, and the hypothesis test confirms that you can reject the null hypothesis of no agreement. This conclusion is further supported by the confidence interval of (0.2030, 0.4868), which suggests that the true kappa is greater than zero. The AGREE option also produces Bowker’s test for symmetry and the weighted kappa coefficient, but that output is not shown here. Figure 40.11 displays the agreement plot for the ratings of the two dermatologists.