The FREQ Procedure

The data set Migraine contains hypothetical data for a clinical trial of migraine treatment. Subjects of both genders receive either a new drug
therapy or a placebo. Their response to treatment is coded as 'Better' or 'Same'. The data are recorded as cell counts, and
the number of subjects for each treatment and response combination is recorded in the variable Count.
data Migraine;
   input Gender $ Treatment $ Response $ Count @@;
   datalines;
female Active  Better 16   female Active  Same 11
female Placebo Better  5   female Placebo Same 20
male   Active  Better 12   male   Active  Same 16
male   Placebo Better  7   male   Placebo Same 19
;
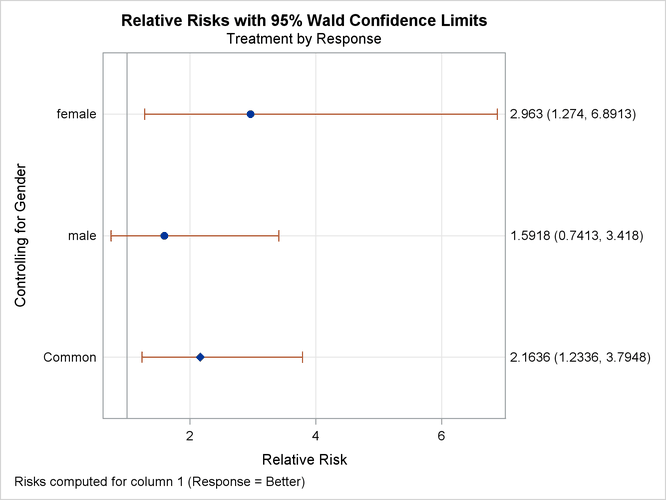
The following PROC FREQ statements create a multiway table stratified by Gender, where Treatment forms the rows and Response forms the columns. The RELRISK option in the TABLES statement requests the odds ratio and relative risks for the two-way
tables of Treatment by Response. The PLOTS= option requests a relative risk plot, which shows the relative risk and its confidence limits for each level
of Gender and overall. The CMH option requests Cochran-Mantel-Haenszel statistics for the multiway table. For this stratified ![]() table, the CMH option also produces estimates of the common relative risk and the Breslow-Day test for homogeneity of the
odds ratios. The NOPRINT option suppresses the display of the crosstabulation tables.
table, the CMH option also produces estimates of the common relative risk and the Breslow-Day test for homogeneity of the
odds ratios. The NOPRINT option suppresses the display of the crosstabulation tables.
ods graphics on;
proc freq data=Migraine;
   tables Gender*Treatment*Response /
          relrisk plots(only)=relriskplot(stats) cmh noprint;
   weight Count;
   title 'Clinical Trial for Treatment of Migraine Headaches';
run;
ods graphics off;
Output 40.7.1 through Output 40.7.4 show the results of the analysis. The relative risk plot (Output 40.7.1) displays the relative risks and confidence limits for the two levels of Gender and for the overall (common) relative risk. Output 40.7.2 displays the CMH statistics. For a stratified ![]() table, the three CMH statistics test the same hypothesis. The significant p-value (0.004) indicates that the association between treatment and response remains strong after adjusting for gender.
table, the three CMH statistics test the same hypothesis. The significant p-value (0.004) indicates that the association between treatment and response remains strong after adjusting for gender.
The CMH option also produces a table of overall relative risks, as shown in Output 40.7.3. Because this is a prospective study, the relative risk estimate assesses the effectiveness of the new drug; the "Cohort (Col1 Risk)" values are the appropriate estimates for the first column (the risk of improvement). The probability of migraine improvement with the new drug is just over two times the probability of improvement with the placebo.
The large p-value for the Breslow-Day test (0.2218) in Output 40.7.4 indicates no significant gender difference in the odds ratios.
Output 40.7.3: CMH Option: Common Relative Risks
| Common Odds Ratio and Relative Risks | ||||
|---|---|---|---|---|
| Statistic | Method | Value | 95% Confidence Limits | |
| Odds Ratio | Mantel-Haenszel | 3.3132 | 1.4456 | 7.5934 |
| Logit | 3.2941 | 1.4182 | 7.6515 | |
| Relative Risk (Column 1) | Mantel-Haenszel | 2.1636 | 1.2336 | 3.7948 |
| Logit | 2.1059 | 1.1951 | 3.7108 | |
| Relative Risk (Column 2) | Mantel-Haenszel | 0.6420 | 0.4705 | 0.8761 |
| Logit | 0.6613 | 0.4852 | 0.9013 | |