The POWER Procedure
- Overview
-
Getting Started

-
Syntax
-
Details
-
ExamplesOne-Way ANOVAThe Sawtooth Power Function in Proportion AnalysesSimple AB/BA Crossover DesignsNoninferiority Test with Lognormal DataMultiple Regression and CorrelationComparing Two Survival CurvesConfidence Interval PrecisionCustomizing PlotsBinary Logistic Regression with Independent PredictorsWilcoxon-Mann-Whitney Test
- References
Choosing Key (Legend) Styles
The default style for the key (or “legend”) is one that displays the association between levels of features and levels of analysis parameters, located below the X axis. For example, Output 71.8.5 demonstrates this style of key.
You can reproduce Output 71.8.5 with the same key but a different location, inside the plotting region, by using the POS=INSET option within the KEY=BYFEATURE option in the PLOT statement. The following statements product the plot in Output 71.8.17:
proc power plotonly;
   twosamplemeans test=diff
      groupmeans   = 12 | 15 18
      stddev       = 7 9
      power        = .
      ntotal       = 200;
   plot x=n min=20 max=500
      key = byfeature(pos=inset);
run;
Output 71.8.17: Plot with a By-Feature Key inside the Plotting Region

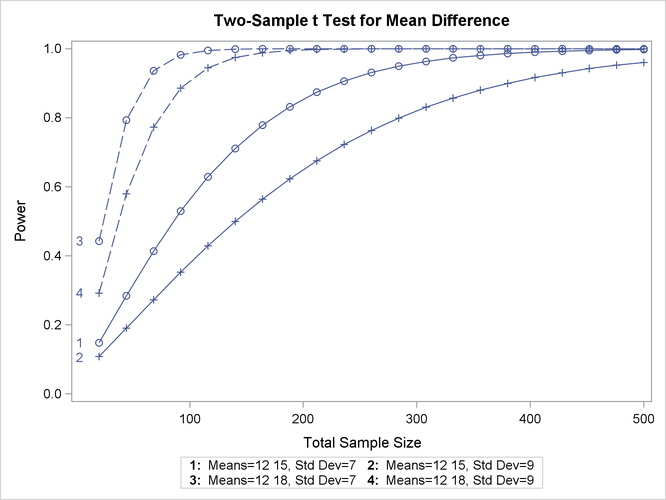
Alternatively, you can specify a key that identifies each individual curve separately by number by using the KEY=BYCURVE option in the PLOT statement:
   plot x=n min=20 max=500
      key = bycurve;
The resulting plot is shown in Output 71.8.18.
Output 71.8.18: Plot with a Numbered By-Curve Key
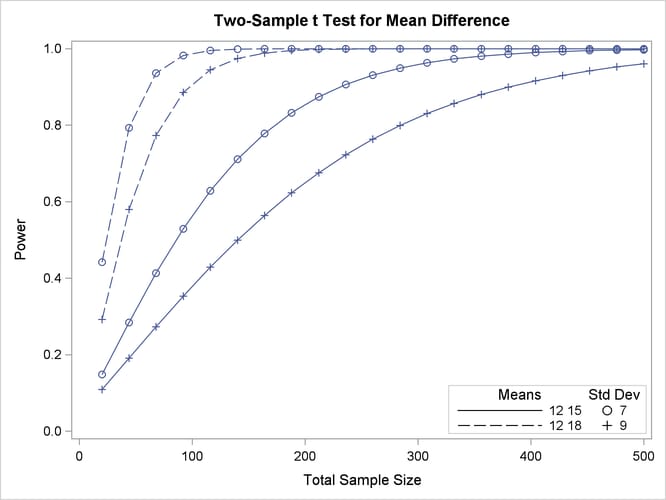
Use the NUMBERS=OFF option within the KEY=BYCURVE option to specify a nonnumbered key that identifies curves with samples of line styles, symbols, and colors:
   plot x=n min=20 max=500
      key = bycurve(numbers=off pos=inset);
The POS=INSET suboption places the key within the plotting region. The resulting plot is shown in Output 71.8.19.
Output 71.8.19: Plot with a Nonnumbered By-Curve Key
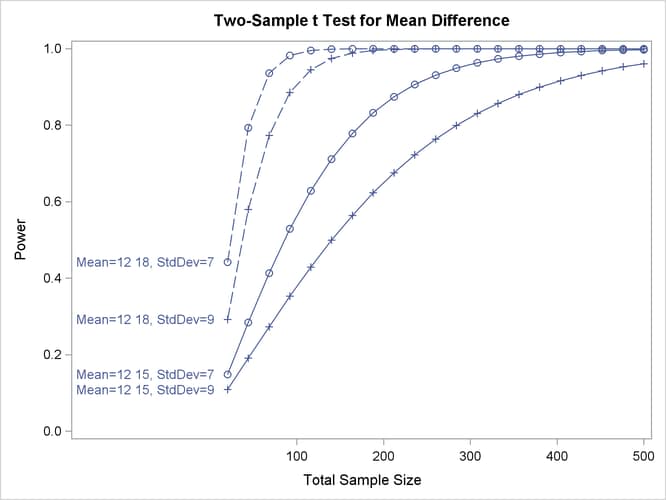
Finally, you can attach labels directly to curves with the KEY=ONCURVES option. The following PLOT statement produces Output 71.8.20:
   plot x=n min=20 max=500
      key = oncurves;
Output 71.8.20: Plot with Directly Labeled Curves