The POWER Procedure
- Overview
-
Getting Started

-
Syntax
-
Details
-
ExamplesOne-Way ANOVAThe Sawtooth Power Function in Proportion AnalysesSimple AB/BA Crossover DesignsNoninferiority Test with Lognormal DataMultiple Regression and CorrelationComparing Two Survival CurvesConfidence Interval PrecisionCustomizing PlotsBinary Logistic Regression with Independent PredictorsWilcoxon-Mann-Whitney Test
- References
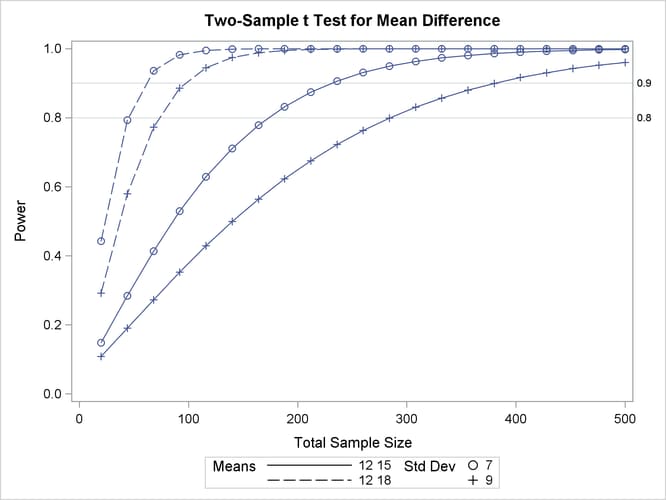
Adding Reference Lines
Suppose you want to add reference lines to highlight power=0.8 and power=0.9 on the plot in Output 71.8.5. You can add simple reference lines by using the YOPTS= option and REF= suboption in the PLOT statement to produce Output 71.8.11, with the following statements:
proc power plotonly;
   twosamplemeans test=diff
      groupmeans   = 12 | 15 18
      stddev       = 7 9
      power        = .
      ntotal       = 100;
   plot x=n min=20 max=500
      yopts=(ref=0.8 0.9);
run;
Output 71.8.11: Plot with Simple Reference Lines on Y Axis
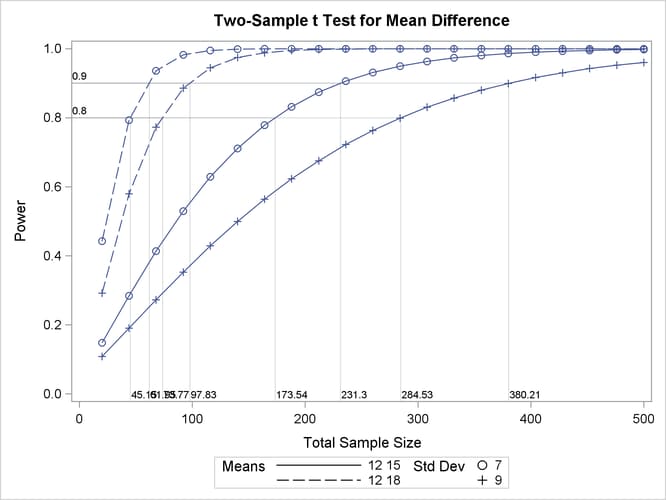
Or you can specify CROSSREF=YES to add reference lines that intersect each curve and cross over to the other axis:
   plot x=n min=20 max=500
      yopts=(ref=0.8 0.9 crossref=yes);
The resulting plot is shown in Output 71.8.12.
Output 71.8.12: Plot with CROSSREF=YES Style Reference Lines from Y Axis
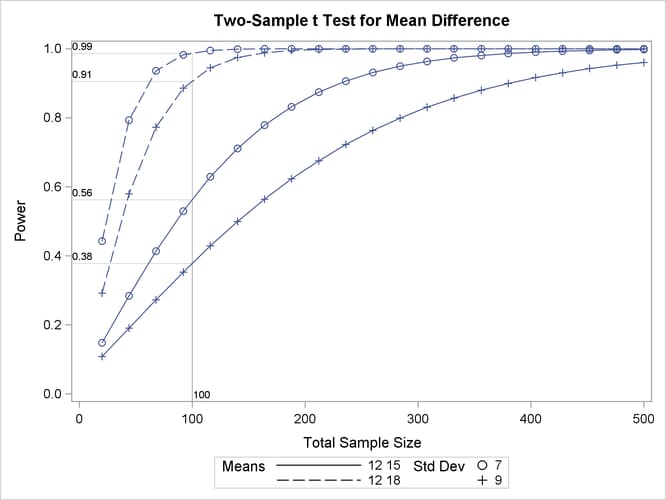
You can also add reference lines for the X axis by using the XOPTS= option instead of the YOPTS= option. For example, the following PLOT statement produces Output 71.8.13, which has crossing reference lines highlighting the sample size of 100:
   plot x=n min=20 max=500
      xopts=(ref=100 crossref=yes);
Note that the values that label the reference lines at the X axis in Output 71.8.12 and at the Y axis in Output 71.8.13 are linearly interpolated from two neighboring points on the curves. Thus they might not exactly match corresponding values that are computed directly from the methods in the section Computational Methods and Formulas—that is, computed by PROC POWER in the absence of a PLOT statement. The two ways of computing these values generally differ by a negligible amount.
Output 71.8.13: Plot with CROSSREF=YES Style Reference Lines from X Axis