The MODECLUS Procedure

Example 59.3 Cluster Analysis with Significance Tests
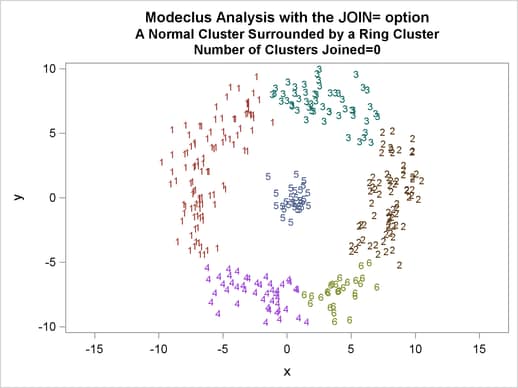
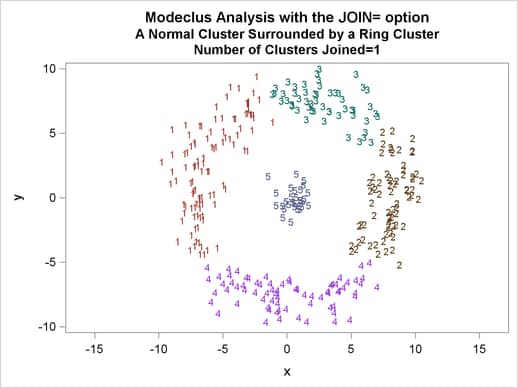
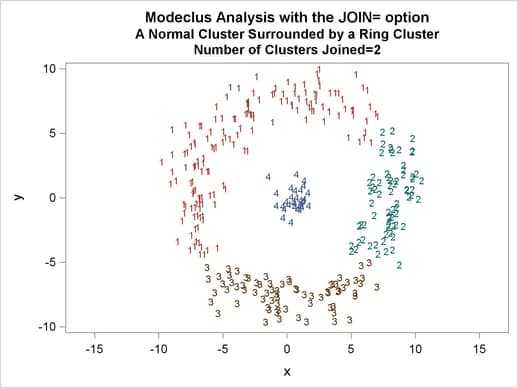
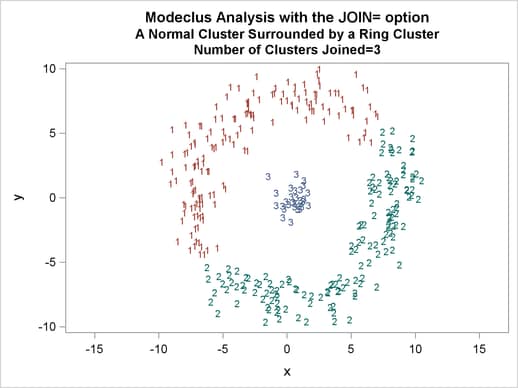
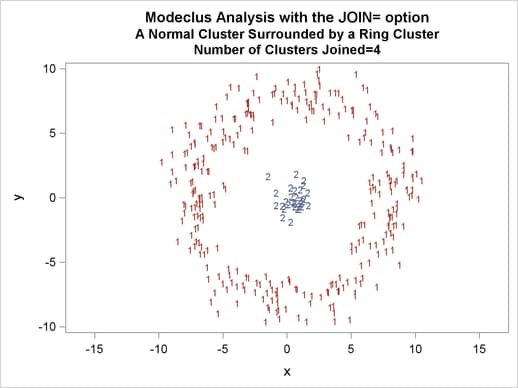
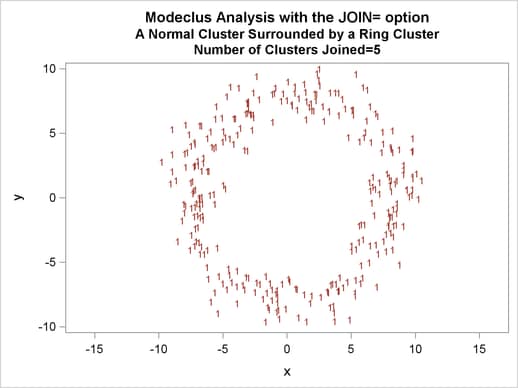
This example uses artificial data containing two clusters. One cluster is from a circular bivariate normal distribution. The other is a ring-shaped cluster that completely surrounds the first cluster. Without significance tests, the ring is divided into several sample clusters for any degree of smoothing that yields reasonable density estimates. The JOIN= option puts the ring back together. Output 59.3.1 displays a short summary generated from the first PROC MODECLUS statement. Output 59.3.2 contains a series of tables produced from the second PROC MODECLUS statement. The lack of p-value in the JOIN= option makes joining continue until only one cluster remains (see the description of the JOIN= option). The cluster memberships are then plotted as displayed in Output 59.3.1 through Output 59.3.8.
The following statements produce Output 59.3.1 through Output 59.3.8:
title  'Modeclus Analysis with the JOIN= option';
title2 'A Normal Cluster Surrounded by a Ring Cluster';

data circle; keep x y;
   c=1;
   do n=1 to 30;
      x=rannor(5);
      y=rannor(5);
      output;
   end;

   c=2;
   do n=1 to 300;
      x=rannor(5);
      y=rannor(5);
      z=rannor(5)+8;
      l=z/sqrt(x**2+y**2);
      x=x*l;
      y=y*l;
      output;
   end;
run;
proc modeclus data=circle m=1 r=1 to 3.5 by .25 join=20 short;
run;
proc modeclus data=circle m=1 r=2.5 join out=out;
run;
proc sgplot data=out noautolegend;
   yaxis values=(-10 to 10 by 5);
   xaxis values=(-15 to 15 by 5);
   scatter y=y x=x / group=cluster Markerchar=cluster;
   by _NJOIN_;
run;
| Modeclus Analysis with the JOIN= option |
| A Normal Cluster Surrounded by a Ring Cluster |
| Cluster Summary | ||||
|---|---|---|---|---|
| R | Number of Clusters Joined |
Maximum P-value |
Number of Clusters |
Frequency of Unclassified Objects |
| 1 | 36 | 0.9339 | 1 | 301 |
| 1.25 | 20 | 0.7131 | 1 | 301 |
| 1.5 | 10 | 0.3296 | 1 | 300 |
| 1.75 | 5 | 0.1990 | 2 | 0 |
| 2 | 5 | 0.0683 | 2 | 0 |
| 2.25 | 3 | 0.0504 | 2 | 0 |
| 2.5 | 4 | 0.0301 | 2 | 0 |
| 2.75 | 3 | 0.0585 | 2 | 0 |
| 3 | 5 | 0.0003 | 1 | 0 |
| 3.25 | 4 | 0.1923 | 2 | 0 |
| 3.5 | 4 | 0.0000 | 1 | 0 |
| Modeclus Analysis with the JOIN= option |
| A Normal Cluster Surrounded by a Ring Cluster |
| Cluster Statistics | -Saddle Test: Version 92.7- | ||||||||
|---|---|---|---|---|---|---|---|---|---|
| Cluster | Frequency | Maximum Estimated Density |
Boundary Frequency |
Estimated Saddle Density |
Mode Count |
Saddle Count |
Overlap Count |
Z | Approx P-value |
| 1 | 103 | 0.00617328 | 22 | 0.00308664 | 39 | 19 | 0 | 2.495 | 0.5055 |
| 2 | 71 | 0.00571029 | 20 | 0.0043213 | 36 | 27 | 9 | 1.193 | 0.999 |
| 3 | 53 | 0.00509296 | 18 | 0.00401263 | 32 | 25 | 10 | 0.986 | 0.9999 |
| 4 | 45 | 0.00478429 | 19 | 0.00354964 | 30 | 22 | 14 | 1.429 | 0.9924 |
| 5 | 30 | 0.00462996 | 0 | . | 29 | 0 | . | 3.611 | 0.0301 |
| 6 | 28 | 0.00370397 | 17 | 0.00354964 | 23 | 22 | 9 | 0.000 | 1 |
| Cluster Statistics | -Saddle Test: Version 92.7- | ||||||||
|---|---|---|---|---|---|---|---|---|---|
| Cluster | Frequency | Maximum Estimated Density |
Boundary Frequency |
Estimated Saddle Density |
Mode Count |
Saddle Count |
Overlap Count |
Z | Approx P-value |
| 1 | 103 | 0.00617328 | 22 | 0.00308664 | 39 | 19 | 0 | 2.495 | 0.5055 |
| 2 | 71 | 0.00571029 | 20 | 0.0043213 | 36 | 27 | 9 | 1.193 | 0.999 |
| 3 | 53 | 0.00509296 | 18 | 0.00401263 | 32 | 25 | 10 | 0.986 | 0.9999 |
| 4 | 73 | 0.00478429 | 13 | 0.00293231 | 30 | 18 | 0 | 1.588 | 0.9778 |
| 5 | 30 | 0.00462996 | 0 | . | 29 | 0 | . | 3.611 | 0.0301 |
| Cluster Statistics | -Saddle Test: Version 92.7- | ||||||||
|---|---|---|---|---|---|---|---|---|---|
| Cluster | Frequency | Maximum Estimated Density |
Boundary Frequency |
Estimated Saddle Density |
Mode Count |
Saddle Count |
Overlap Count |
Z | Approx P-value |
| 1 | 156 | 0.00617328 | 17 | 0.00246931 | 39 | 15 | 0 | 3.130 | 0.1318 |
| 2 | 71 | 0.00571029 | 20 | 0.0043213 | 36 | 27 | 9 | 1.193 | 0.999 |
| 3 | 73 | 0.00478429 | 13 | 0.00293231 | 30 | 18 | 0 | 1.588 | 0.9778 |
| 4 | 30 | 0.00462996 | 0 | . | 29 | 0 | . | 3.611 | 0.0301 |
| Cluster Statistics | -Saddle Test: Version 92.7- | ||||||||
|---|---|---|---|---|---|---|---|---|---|
| Cluster | Frequency | Maximum Estimated Density |
Boundary Frequency |
Estimated Saddle Density |
Mode Count |
Saddle Count |
Overlap Count |
Z | Approx P-value |
| 1 | 156 | 0.00617328 | 17 | 0.00246931 | 39 | 15 | 0 | 3.130 | 0.1318 |
| 2 | 144 | 0.00571029 | 14 | 0.00293231 | 36 | 18 | 0 | 2.313 | 0.6447 |
| 3 | 30 | 0.00462996 | 0 | . | 29 | 0 | . | 3.611 | 0.0301 |
| Cluster Statistics | -Saddle Test: Version 92.7- | ||||||||
|---|---|---|---|---|---|---|---|---|---|
| Cluster | Frequency | Maximum Estimated Density |
Boundary Frequency |
Estimated Saddle Density |
Mode Count |
Saddle Count |
Overlap Count |
Z | Approx P-value |
| 1 | 300 | 0.00617328 | 0 | . | 39 | 0 | . | 4.246 | 0.0026 |
| 2 | 30 | 0.00462996 | 0 | . | 29 | 0 | . | 3.611 | 0.0301 |
| Cluster Statistics | -Saddle Test: Version 92.7- | ||||||||
|---|---|---|---|---|---|---|---|---|---|
| Cluster | Frequency | Maximum Estimated Density |
Boundary Frequency |
Estimated Saddle Density |
Mode Count |
Saddle Count |
Overlap Count |
Z | Approx P-value |
| 1 | 300 | 0.00617328 | 0 | . | 39 | 0 | . | 4.246 | 0.0026 |
| Modeclus Analysis with the JOIN= option |
| A Normal Cluster Surrounded by a Ring Cluster |
| Cluster Summary | ||||
|---|---|---|---|---|
| R | Number of Clusters Joined |
Maximum P-value |
Number of Clusters |
Frequency of Unclassified Objects |
| 2.5 | 0 | 1.0000 | 6 | 0 |
| 2.5 | 1 | 0.9999 | 5 | 0 |
| 2.5 | 2 | 0.9990 | 4 | 0 |
| 2.5 | 3 | 0.6447 | 3 | 0 |
| 2.5 | 4 | 0.0301 | 2 | 0 |
| 2.5 | 5 | 0.0026 | 1 | 30 |