The MODECLUS Procedure

Example 59.1 Cluster Analysis of Samples from Univariate Distributions
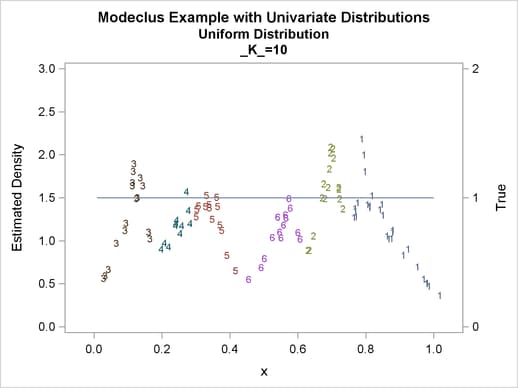
This example uses pseudo-random samples from a uniform distribution, an exponential distribution, and a bimodal mixture of two normal distributions. Results are presented in Output 59.1.1 through Output 59.1.18 as plots displaying both the true density and the estimated density, as well as cluster membership.
The following statements produce Output 59.1.1 through Output 59.1.4:
title 'Modeclus Example with Univariate Distributions';
title2 'Uniform Distribution';

data uniform;
   drop n;
   true=1;
   do n=1 to 100;
      x=ranuni(123);
      output;
   end;
run;
proc modeclus data=uniform m=1 k=10 20 40 60 out=out short;
   var x;
run;

proc sgplot data=out noautolegend;
   y2axis label='True' values=(0 to 2 by 1.);
   yaxis values=(0 to 3 by 0.5);
   scatter y=density x=x / markerchar=cluster group=cluster;
   pbspline y=true x=x / y2axis nomarkers lineattrs=(thickness= 1);
   by _K_;
run;
proc modeclus data=uniform m=1 r=.05 .10 .20 .30 out=out short;
   var x;
run;

proc sgplot data=out noautolegend;
   y2axis label='True' values=(0 to 2 by 1.);
   yaxis values=(0 to 2 by 0.5);
   scatter y=density x=x / markerchar=cluster group=cluster;
   pbspline y=true x=x / y2axis nomarkers lineattrs=(thickness= 1);
   by _R_;
run;
Output 59.1.1
Cluster Analysis of Sample from a Uniform Distribution
| Modeclus Example with Univariate Distributions |
| Uniform Distribution |
The MODECLUS Procedure
| Cluster Summary | ||
|---|---|---|
| K | Number of Clusters |
Frequency of Unclassified Objects |
| 10 | 6 | 0 |
| 20 | 3 | 0 |
| 40 | 2 | 0 |
| 60 | 1 | 0 |
Output 59.1.2
True Density, Estimated Density, and Cluster Membership by Various _K_ Values


Output 59.1.3
Cluster Analysis of Sample from a Uniform Distribution
| Modeclus Example with Univariate Distributions |
| Uniform Distribution |
The MODECLUS Procedure
| Cluster Summary | ||
|---|---|---|
| R | Number of Clusters |
Frequency of Unclassified Objects |
| 0.05 | 4 | 0 |
| 0.1 | 2 | 0 |
| 0.2 | 2 | 0 |
| 0.3 | 1 | 0 |
Output 59.1.4
True Density, Estimated Density, and Cluster Membership by Various _R_ Values


The following statements produce Output 59.1.5 through Output 59.1.12:
data expon;
   title2 'Exponential Distribution';
   drop n;
   do n=1 to 100;
      x=ranexp(123);
      true=exp(-x);
      output;
   end;
run;
proc modeclus data=expon m=1 k=10 20 40 out=out short;
   var x;
run;

proc sgplot data=out noautolegend;
   y2axis label='True' values=(0 to 1 by .5);
   yaxis values=(0 to 2 by 0.5);
   scatter y=density x=x / markerchar=cluster group=cluster;
   pbspline y=true x=x / y2axis nomarkers lineattrs=(thickness= 1);
   by _K_;
run;
proc modeclus data=expon m=1 r=.20 .40 .80 out=out short;
   var x;
run;

proc sgplot data=out noautolegend;
   y2axis label='True' values=(0 to 1 by .5);
   yaxis values=(0 to 1 by 0.5);
   scatter y=density x=x / markerchar=cluster group=cluster;
   pbspline y=true x=x / y2axis nomarkers lineattrs=(thickness= 1);
   by _R_;
run;
title3 'Different Density-Estimation and Clustering Windows';

proc modeclus data=expon m=1 r=.20 ck=10 20 40
              out=out short;
   var x;
run;

proc sgplot data=out noautolegend;
   y2axis label='True' values=(0 to 1 by .5);
   yaxis values=(0 to 1 by 0.5);
   scatter y=density x=x / markerchar=cluster group=cluster;
   pbspline y=true x=x / y2axis nomarkers lineattrs=(thickness= 1);
   by _CK_;
run;
title3 'Cascaded Density Estimates Using Arithmetic Means';

proc modeclus data=expon m=1 r=.20 cascade=1 2 4 am out=out short;
   var x;
run;

proc sgplot data=out noautolegend;
   y2axis label='True' values=(0 to 1 by .5);
   yaxis values=(0 to 1 by 0.5);
   scatter y=density x=x / markerchar=cluster group=cluster;
   pbspline y=true x=x / y2axis nomarkers lineattrs=(thickness= 1);
   by _R_ _CASCAD_;
run;
Output 59.1.5
Cluster Analysis of Sample from an Exponential Distribution
| Modeclus Example with Univariate Distributions |
| Exponential Distribution |
The MODECLUS Procedure
| Cluster Summary | ||
|---|---|---|
| K | Number of Clusters |
Frequency of Unclassified Objects |
| 10 | 5 | 0 |
| 20 | 3 | 0 |
| 40 | 1 | 0 |
Output 59.1.6
True Density, Estimated Density, and Cluster Membership by Various _K_ Values


Output 59.1.7
Cluster Analysis of Sample from an Exponential Distribution
| Modeclus Example with Univariate Distributions |
| Exponential Distribution |
The MODECLUS Procedure
| Cluster Summary | ||
|---|---|---|
| R | Number of Clusters |
Frequency of Unclassified Objects |
| 0.2 | 8 | 0 |
| 0.4 | 6 | 0 |
| 0.8 | 1 | 0 |
Output 59.1.8
True Density, Estimated Density, and Cluster Membership by Various _R_ Values


Output 59.1.9
Cluster Analysis of Sample from an Exponential Distribution
| Modeclus Example with Univariate Distributions |
| Exponential Distribution |
| Different Density-Estimation and Clustering Windows |
The MODECLUS Procedure
| Cluster Summary | |||
|---|---|---|---|
| R | CK | Number of Clusters |
Frequency of Unclassified Objects |
| 0.2 | 10 | 3 | 0 |
| 0.2 | 20 | 2 | 0 |
| 0.2 | 40 | 1 | 0 |
Output 59.1.10
True Density, Estimated Density, and Cluster Membership by _R_=0.2 with Various _CK_ Values


Output 59.1.11
Cluster Analysis of Sample from an Exponential Distribution
| Modeclus Example with Univariate Distributions |
| Exponential Distribution |
| Cascaded Density Estimates Using Arithmetic Means |
The MODECLUS Procedure
| Cluster Summary | |||
|---|---|---|---|
| R | Cascade | Number of Clusters |
Frequency of Unclassified Objects |
| 0.2 | 1 | 8 | 0 |
| 0.2 | 2 | 8 | 0 |
| 0.2 | 4 | 7 | 0 |
Output 59.1.12
True Density, Estimated Density, and Cluster Membership by _R_=0.2 with Various _CASCAD_ Values


The following statements produce Output 59.1.13 through Output 59.1.18:
title2 'Normal Mixture Distribution';

data normix;
   drop n sigma;
   sigma=.125;
   do n=1 to 100;
      x=rannor(456)*sigma+mod(n,2)/2;
      true=exp(-.5*(x/sigma)**2)+exp(-.5*((x-.5)/sigma)**2);
      true=.5*true/(sigma*sqrt(2*3.1415926536));
      output;
   end;
run;
proc modeclus data=normix m=1 k=10 20 40 60 out=out short;
   var x;
run;

proc sgplot data=out noautolegend;
   y2axis label='True' values=(0 to 1.6 by .1);
   yaxis values=(0 to 3 by 0.5);
   scatter y=density x=x / markerchar=cluster group=cluster;
   pbspline y=true x=x / y2axis nomarkers lineattrs=(thickness= 1);
   by _K_;
run;
proc modeclus data=normix m=1 r=.05 .10 .20 .30 out=out short;
   var x;
run;

proc sgplot data=out noautolegend;
   y2axis label='True' values=(0 to 1.6 by .1);
   yaxis values=(0 to 3 by 0.5);
   scatter y=density x=x / markerchar=cluster group=cluster;
   pbspline y=true x=x / y2axis nomarkers lineattrs=(thickness= 1);
   by _R_;
run;
title3 'Cascaded Density Estimates Using Arithmetic Means';

proc modeclus data=normix m=1 r=.05 cascade=1 2 4 am out=out short;
   var x;
run;

proc sgplot data=out noautolegend;
   y2axis label='True' values=(0 to 1.6 by .1);
   yaxis values=(0 to 2 by 0.5);
   scatter y=density x=x / markerchar=cluster group=cluster;
   pbspline y=true x=x / y2axis nomarkers lineattrs=(thickness= 1);
   by _R_ _CASCAD_;
run;
Output 59.1.13
Cluster Analysis of Sample from a Bimodal Mixture of Two Normal Distributions
| Modeclus Example with Univariate Distributions |
| Normal Mixture Distribution |
The MODECLUS Procedure
| Cluster Summary | ||
|---|---|---|
| K | Number of Clusters |
Frequency of Unclassified Objects |
| 10 | 7 | 0 |
| 20 | 2 | 0 |
| 40 | 2 | 0 |
| 60 | 1 | 0 |
Output 59.1.14
True Density, Estimated Density, and Cluster Membership by Various _K_ Values


Output 59.1.15
Cluster Analysis of Sample from a Bimodal Mixture of Two Normal Distributions
| Modeclus Example with Univariate Distributions |
| Normal Mixture Distribution |
The MODECLUS Procedure
| Cluster Summary | ||
|---|---|---|
| R | Number of Clusters |
Frequency of Unclassified Objects |
| 0.05 | 5 | 0 |
| 0.1 | 2 | 0 |
| 0.2 | 2 | 0 |
| 0.3 | 1 | 0 |
Output 59.1.16
True Density, Estimated Density, and Cluster Membership by Various _R_= Values


Output 59.1.17
Cluster Analysis of Sample from a Bimodal Mixture of Two Normal Distributions
| Modeclus Example with Univariate Distributions |
| Normal Mixture Distribution |
| Cascaded Density Estimates Using Arithmetic Means |
The MODECLUS Procedure
| Cluster Summary | |||
|---|---|---|---|
| R | Cascade | Number of Clusters |
Frequency of Unclassified Objects |
| 0.05 | 1 | 5 | 0 |
| 0.05 | 2 | 4 | 0 |
| 0.05 | 4 | 4 | 0 |
Output 59.1.18
True Density, Estimated Density, and Cluster Membership by _R_=0.05 with Various _CASCAD_ Values


