| Multivariate Analyses |
Output
To view or change the output options associated with your multivariate analysis, click on the Output button from the variables dialog. This displays the output options dialog.
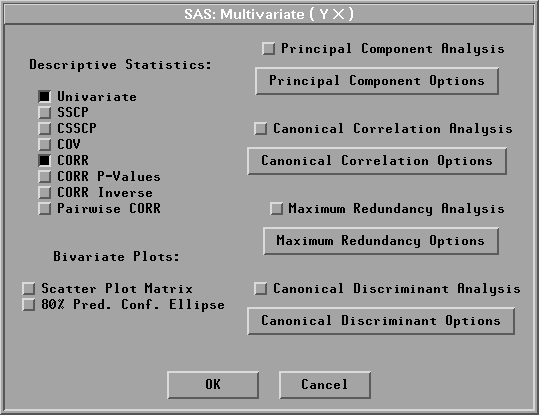
Figure 40.5: Multivariate Output Options Dialog
The options you set in this dialog determine which tables and graphs appear in the multivariate window. SAS/INSIGHT software provides univariate statistics and correlation matrix tables by default.
Descriptive statistics provide tables for examining the relationships among quantitative variables from univariate, bivariate, and multivariate perspectives.
Plots can be more informative than tables when you are trying to understand multivariate data. You can display a matrix of scatter plots for the analyzing variables. You can also add a bivariate confidence ellipse for mean or predicted values to the scatter plots. Using the confidence ellipses assumes each pair of variables has a bivariate normal distribution.
With appropriate variables chosen, you can generate principal component analysis (interval Y variables), canonical correlation analysis (interval Y, X variables), maximum redundancy analysis (interval Y, X variables), and canonical discriminant analysis (one nominal Y variable, interval X variables) by selecting the corresponding checkbox in the Output Options dialog.
Principal Component Analysis
Principal Component Rotation
Canonical Correlation Analysis
Maximum Redundancy Analysis
Canonical Discriminant Analysis
Copyright © 2007 by SAS Institute Inc., Cary, NC, USA. All rights reserved.