| Multivariate Analyses |
Principal Component Analysis
Clicking the Principal Component Options button in the Output Options dialog shown in Figure 40.5 displays the dialog shown in Figure 40.6.
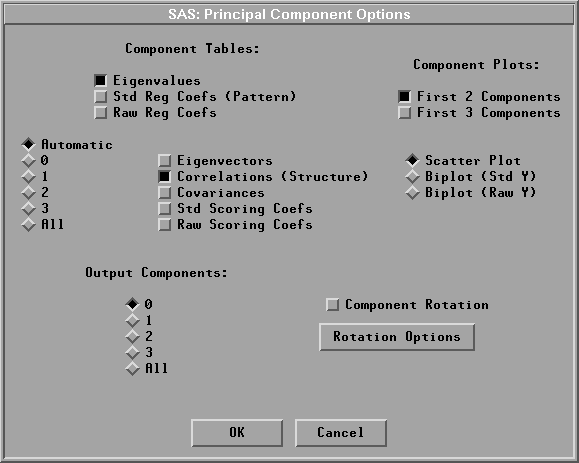
Figure 40.6: Principal Components Options Dialog
The dialog enables you to view or change the output options associated with principal component analyses and save principal component scores in the data window.
In the dialog, you need to specify the number of components when selecting tables of Eigenvectors, Correlations (Structure), Covariances, Std Scoring Coefs, and Raw Scoring Coefs. Automatic uses principal components with corresponding eigenvalues greater than the average eigenvalue. By default, SAS/INSIGHT software displays a plot of the first two principal components, a table of all the eigenvalues, and a table of correlations between the Y variables and principal components with corresponding eigenvalues greater than the average eigenvalue.
You can generate principal component rotation analysis by selecting the Component Rotation checkbox in the dialog.
Copyright © 2007 by SAS Institute Inc., Cary, NC, USA. All rights reserved.