| Multivariate Analyses |
Canonical Correlation Analysis
Clicking the Canonical Correlation Options button in the Output Options dialog shown in Figure 40.5 displays the dialog shown in Figure 40.8.
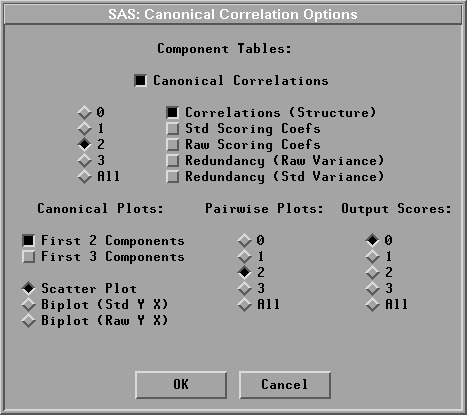
Figure 40.8: Canonical Correlation Options Dialog
This dialog enables you to view or change the options associated with canonical correlation analyses and save maximum redundancy variable scores in the data window. You specify the number of components when selecting tables of Correlations (Structure), Std Scoring Coefs, Raw Scoring Coefs, Redundancy (Raw Variance), and Redundancy (Std Variance).
By default, SAS/INSIGHT software displays a plot of the first two canonical variables, plots of the first two pairs of canonical variables, a canonical correlations table, and a table of correlations between the Y, X variables and the first two canonical variables from both Y variables and X variables.
Copyright © 2007 by SAS Institute Inc., Cary, NC, USA. All rights reserved.