| Multivariate Analyses |
Canonical Discriminant Analysis
Clicking the Canonical Discriminant Options button in the Output Options dialog shown in Figure 40.5 displays the dialog shown in Figure 40.10.
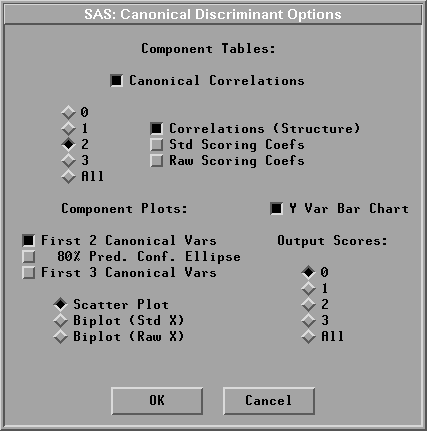
Figure 40.10: Canonical Discriminant Options Dialog
You specify the number of components when selecting tables of Correlations (Structure), Std Scoring Coefs, and Raw Scoring Coefs.
By default, SAS/INSIGHT software displays a plot of the first two canonical variables, a bar chart for the nominal Y variable, a canonical correlation table, and a table of correlations between the X variables and the first two canonical variables.
Copyright © 2007 by SAS Institute Inc., Cary, NC, USA. All rights reserved.